. 2025 Jan 30;21(1):e1012748.
doi: 10.1371/journal.pcbi.1012748. eCollection 2025 Jan.

ASGCL: Adaptive Sparse Mapping-based graph contrastive learning network for cancer drug response prediction

Affiliations

ASGCL: Adaptive Sparse Mapping-based graph contrastive learning network for cancer drug response prediction

Yunyun Dong et al. PLoS Comput Biol. .

Abstract

Personalized cancer drug treatment is emerging as a frontier issue in modern medical research. Considering the genomic differences among cancer patients, determining the most effective drug treatment plan is a complex and crucial task. In response to these challenges, this study introduces the Adaptive Sparse Graph Contrastive Learning Network (ASGCL), an innovative approach to unraveling latent interactions in the complex context of cancer cell lines and drugs. The core of ASGCL is the GraphMorpher module, an innovative component that enhances the input graph structure via strategic node attribute masking and topological pruning. By contrasting the augmented graph with the original input, the model delineates distinct positive and negative sample sets at both node and graph levels. This dual-level contrastive approach significantly amplifies the model's discriminatory prowess in identifying nuanced drug responses. Leveraging a synergistic combination of supervised and contrastive loss, ASGCL accomplishes end-to-end learning of feature representations, substantially outperforming existing methodologies. Comprehensive ablation studies underscore the efficacy of each component, corroborating the model's robustness. Experimental evaluations further illuminate ASGCL's proficiency in predicting drug responses, offering a potent tool for guiding clinical decision-making in cancer therapy.


Conflict of interest statement

The authors have declared that no competing interests exist.

Figures

Fig 1
Fig 1. ROC curves of ASGCL model and five comparison models.
(a) ROC curves on GDSC dataset (b) ROC curves on CCLE dataset.
Fig 2
Fig 2. Scatter plot of predicting drug response (IC50 value) in GDSC using ASGCL model.
Fig 3
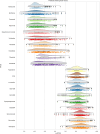
Fig 3. Predict the IC50 values of unknown cell line drug reactions grouped by drugs.
Drugs are classified based on the median predicted IC50 values of all missing cell lines, and the top 10 drugs with the highest median IC50 have the worst efficacy; The last 10 drugs with the lowest IC50 median may be the most effective.
Fig 4
Fig 4. Research on ablation of nonlinear subspaces.
Fig 5
Fig 5. Comparative experiments on different graph encoders in different neighborhoods.
(a) Experimental results of GCN on different neighborhood layers (b) Experimental results of GAT on different neighborhood layers
Fig 6
Fig 6. The impact of the parameter.
ρN on the ASGCL model’s performance is demonstrated, where the blue dotted line represents the baseline result of the ASGCL model on the GDSC dataset when the parameter ρ is not introduced.
Fig 7
Fig 7. The impact of the parameter on ρ.
The ASGCL model’s performance is demonstrated, where the blue dotted line represents the baseline result of the ASGCL model on the GDSC dataset when the parameter ρN is not introduced.
Fig 8
Fig 8. The parameter ρN and ρ impact the performance of the ASGCL model on the GDSC dataset.
In the graph, the colors represent the magnitude of the ASGCL’s performance: darker colors correspond to higher AUC values, while lighter colors indicate lower AUC values.
Fig 9
Fig 9. Schematic diagram of the ASGCL model.
Module A utilizes a nonlinear subspace to extract cell line and drug features as primary characteristics; Module B, named GraphMorpher, adaptively sparsify the input graph structure; Module C is a contrastive learning module, which enhances the model’s discriminative ability by processing and comparing multiple graph structures.
Fig 10
Fig 10. Schematic diagram of nonlinear subspace module.
Fig 11
Fig 11. GraphMorpher diagram.

References

    1. Garnett MJ, Edelman EJ, Heidorn SJ, Greenman CD, Dastur A, Lau KW et al.., “Systematic identification of genomic markers of drug sensitivity in cancer cells,” Nature, 2012. vol. 483, no. 7391, pp. 570–575. doi: 10.1038/nature11005 - DOI - PMC - PubMed
    1. Sheng J, Li F, Wong STC, “Optimal drug prediction from personal genomics profiles,” IEEE J Biomed Health Inform, 2015. vol. 19, no. 4, pp. 1264–1270. doi: 10.1109/JBHI.2015.2412522 - DOI - PMC - PubMed
    1. “Baptista D, Ferreira PG, Rocha M. Deep learning for drug response prediction in cancer. Brief Bioinform. 2021;22(1):360–79. doi: 10.1093/bib/bbz171 WOS:000634950200028.” - DOI - PubMed
    1. Yang W, Soares J, Greninger P, Edelman EJ, Lightfoot H, Forbes S et al.., “Genomics of Drug Sensitivity in Cancer (GDSC): a resource for therapeutic biomarker discovery in cancer cells,” Nucleic Acids Res, 2012. vol. 41, no. D1, pp. D955–D961. doi: 10.1093/nar/gks1111 - DOI - PMC - PubMed
    1. Li Q, Shi R, Liang F, “Drug sensitivity prediction with high-dimensional mixture regression,” PLoS One, 2019. vol. 14, no. 2, p. e0212108. doi: 10.1371/journal.pone.0212108 - DOI - PMC - PubMed

Substances