. 2025 Feb 4;122(5):e2422694122.
doi: 10.1073/pnas.2422694122. Epub 2025 Jan 30.

Uterine organoids reveal insights into epithelial specification and plasticity in development and disease

Affiliations

Uterine organoids reveal insights into epithelial specification and plasticity in development and disease

Jason A Rizo et al. Proc Natl Acad Sci U S A. .

Abstract

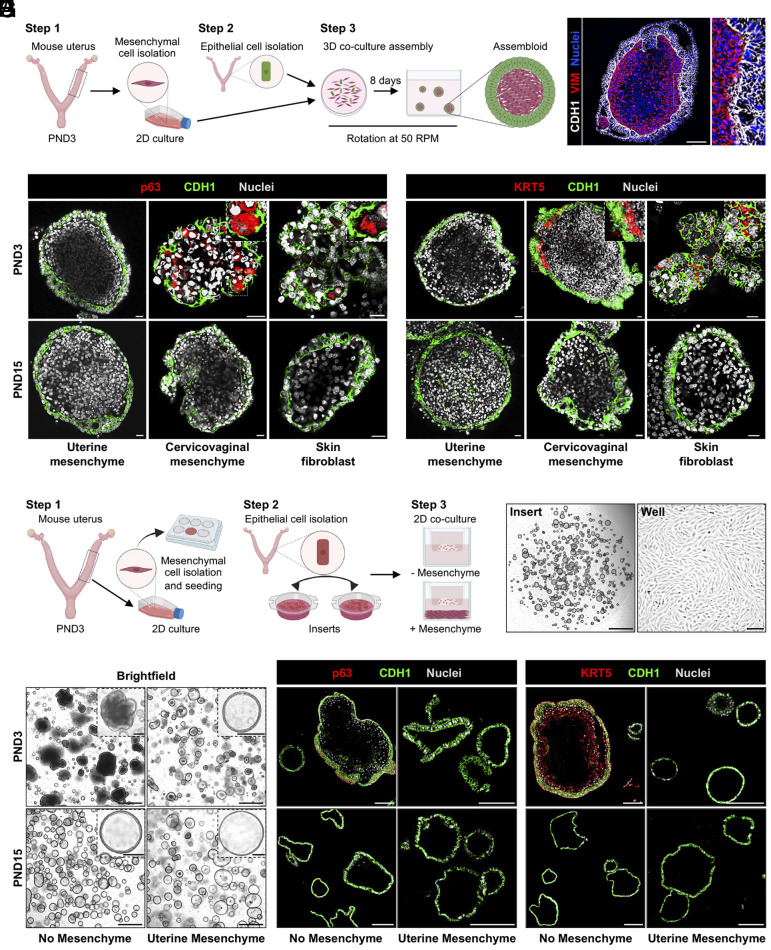
Understanding how epithelial cells in the female reproductive tract (FRT) differentiate is crucial for reproductive health, yet the underlying mechanisms remain poorly defined. At birth, FRT epithelium is highly malleable, allowing differentiation into various epithelial types, but the regulatory pathways guiding these early cell fate decisions are unclear. Here, we use neonatal mouse endometrial organoids and assembloid coculture models to investigate how innate cellular plasticity and external mesenchymal signals influence epithelial differentiation. Our findings demonstrate that uterine epithelium undergoes marked age-dependent changes, transitioning from a highly plastic state capable of forming both monolayered and multilayered structures to a more restricted fate as development progresses. Interestingly, parallels emerge between the developmental plasticity of neonatal uterine epithelium and pathological conditions such as endometrial cancer, where similar regulatory mechanisms may reactivate, driving abnormal epithelial differentiation and tumorigenesis. These results not only deepen our understanding of early uterine development but also offer a valuable model for studying the progression of reproductive diseases and cancers.

Keywords: assembloids; development; epithelium; organoid; uterus.


Conflict of interest statement

Competing interests statement:The authors declare no competing interest.

Figures

Fig. 1.
Fig. 1.
Establishment and characterization of neonatal uterine organoids. (A) Illustration of oviductal, uterine, and cervical organoids established from postnatal day (PND) 3 female reproductive tracts (FRTs); Right panels: immunofluorescent localization of CDH1. (Scale bar, 100 μm.) (B) Representative low magnification bright-field images of endometrial epithelial organoids (EEO) established from PNDs 3, 7, and 15. (Scale bar, 100 μm.) (C) Immunofluorescent localization of Ki67 and CDH1 in EEO across developmental time points (Scale bar, 100 μm); insets represent single-layered (SL) (1) or multilayered (ML) (2) structures. (Scale bar, 20 μm.) (D) Representative images for SL and ML EEO. (Scale bar, 100 μm.) (E and F) Percentage of EEO type (E) and number of ML structures (F) across time points. All experiments were performed on passage 3 organoids (n ≥ 3 biological replicates per PND). Data are presented as mean ± SEM. Solid dots represent technical replicates (n ≥ 3 biological replicates per PND) and letters indicate statistical differences between groups (P < 0.001; ANOVA with the Bonferroni multiple-comparison test). (G) Immunofluorescent localization of Ki67 and CDH1 in neonatal uterine tissues (Scale bar, 100 μm); insets represent epithelium (1) or mesenchyme/stroma (2). (Scale bar, 20 μm.) GE, glandular epithelium; LE, luminal epithelium; Mes, mesenchyme; Str, Stroma.
Fig. 2.
Fig. 2.
Cellular heterogeneity of neonatal EEO. (A) Schematic illustration of experimental design. EEO established from PND 3 and 15 (n = 10 mice per PND) were collected after 8 d of culture and used for single cell RNA sequencing (scRNA-seq). (B) Uniform Manifold Approximation and Projection (UMAP) of cells colored by cell type (Left) or PND (Right); circled clusters represent basal and ciliated epithelium present only in the PND3 samples. (C) Dot plots represent the annotation of cell types based on known marker genes. (D) UMAPs of transcripts for the basal cell markers Trp63, Krt5, and Krt14 in the clusters unique to PND3 EEO. (E) Immunofluorescent localization of p63, KRT5, and KRT14 in EEO at passage 3 or uteri of mice at PND3 (Top) and 15 (Bottom). (Scale bar, 100 μm.) Basal cell markers were only expressed in ML (2) but not in SL (1, 1*) organoids. (Scale bar, 20 μm.)
Fig. 3.
Fig. 3.
Mesenchymal induction of uterine luminal epithelial fate. (A) Protocol for generating uterine assembloids. (B) Representative image of a uterine assembloid stained for epithelial (CDH1) and mesenchymal vimentin (VIM) cell markers. (Scale bar, 100 μm.) (C and D) Whole mount immunofluorescent localization for the basal cell markers p63 and KRT5 in assembloids. (Scale bar, 50 μm.) Assembloids were generated by combining uterine epithelium isolated from PND 3 (Top) or PND15 (Bottom) mice with PND3 uterine, cervicovaginal, or skin mesenchyme/fibroblast. (E) Experimental design for 2D coculture experiments. Epithelial cells were seeded in Cultrex on transwell inserts over PND3 uterine mesenchyme adhered to the bottom of 6-well plates and cultured for 20 d. (F) Representative bright-field images of EEO (Left; Scale bar, 500 μm) and mesenchymal cells (Right; Scale bar, 100 μm) in 2D coculture. (G) Representative bright-field images at day 20 of culture (Scale bar, 500 μm); insets show SL and ML organoids. (Scale bar, 100 μm.) (H and I) Immunofluorescent localization of p63 and KRT5 in organoids from PND3 (Top) and PND15 (Bottom) cocultures. (Scale bar, 100 μm.)
Fig. 4.
Fig. 4.
Epithelial and mesenchymal crosstalk governs neonatal uterine development. (A) UMAP plot of integrated scRNA-seq analysis of mesenchyme (35) and epithelium (27) from neonatal uteri (Top). Violin plots represent annotation of cell types based on known marker genes (Bottom). (B) Heatmap comparing the outgoing (Left) and incoming (Right) signaling patterns associated with both mesenchymal and epithelial cells. Shading denotes the relative signaling strength of a pathway across cell types. Colored bar plots on top depict the signaling strength of a particular cell cluster by summarizing all pathways in the heatmap. (CE) Schematic of outgoing signaling from mesenchymal to epithelial cells for selected pathways. (F) Violin plots confirm the expression of ligands and receptors in each cell type. (G) Heatmap of differentially abundant proteins determined by mass spectrometry analysis of uterine mesenchyme and skin fibroblast conditioned media. Representative bright-field images illustrating the impact of skin fibroblast and uterine mesenchyme on EEO development (Top). (H) UMAP plots of integrated scRNAseq analysis of uterine mesenchyme (35) and EEO from PND3 females colored by cluster (Top Left) or cell type (Top Right). UMAPs in the bottom confirm the expression of ligands in the mesenchyme and receptors in EEOs.
Fig. 5.
Fig. 5.
Conserved epithelial dynamics between uterine development and disease. (A) Heatmap comparing the expression of luminal and basal EEO with human Uterine Corpus Endometrial Carcinoma (UCEC) from The Cancer Genome Atlas (TCGA) program. (B) UMAP of epithelial and stroma cells from human endometrial cancer (57) colored by disease state (Top) and cell type (Bottom). (C) Violin plots represent annotation of cell types based on known marker genes. (D) UMAP plots confirm the downregulation of TGFB superfamily members in the stroma of endometrial cancer samples. (E and F) Immunofluorescent localization of KRT5 in endometrial biopsies (E, Scale bar, 500 μm) and patient-derived endometrial organoids (F, Scale bar, 100 μm; insets 20 μm). (G) Right panels: uteri of wildtype (WT) and PgrCre/+Ptenf/fmice. (Scale bar, 1 cm.) Left panels: immunofluorescent localization of KRT5 staining in uterine tissues. (Scale bar, 100 μm.) (H) Left panels: Representative bright-field images of EEOs established from WT and PgrCre/+Ptenf/fmice. (Scale bar, 500 μm.) Right panels: KRT5 staining is present in ML (2) but absent in SL (1) EEOs (Scale bar, 100 μm; insets 20 μm). White arrows indicate KRT5-positive epithelial cells in mouse and human uterine tissues.

References

    1. Orvis G. D., Behringer R. R., Cellular mechanisms of Mullerian duct formation in the mouse. Dev. Biol. 306, 493–504 (2007). - PMC - PubMed
    1. Mullen R. D., Behringer R. R., Molecular genetics of Müllerian duct formation, regression and differentiation. Sex Dev. 8, 281–296 (2014). - PMC - PubMed
    1. Kurita T., Cunha G. R., Robboy S. J., Mills A. A., Medina R. T., Differential expression of p63 isoforms in female reproductive organs. Mech. Dev. 122, 1043–1055 (2005). - PubMed
    1. Kurita T., Developmental origin of vaginal epithelium. Differentiation 80, 99–105 (2010). - PMC - PubMed
    1. Kurita T., Normal and abnormal epithelial differentiation in the female reproductive tract. Differentiation 82, 117–126 (2011). - PMC - PubMed

LinkOut - more resources