. 2025;19(5):101466.
doi: 10.1016/j.jcmgh.2025.101466. Epub 2025 Jan 28.

Interferon-γ Signaling in Eosinophilic Esophagitis Affects Epithelial Barrier Function and Programmed Cell Death

Affiliations

Interferon-γ Signaling in Eosinophilic Esophagitis Affects Epithelial Barrier Function and Programmed Cell Death

Megha Lal et al. Cell Mol Gastroenterol Hepatol. 2025.

Abstract

Background & aims: Eosinophilic esophagitis (EoE) is a chronic esophageal inflammatory disorder characterized by eosinophil-rich mucosal inflammation and tissue remodeling. Prior research has revealed the upregulation of interferon (IFN) response signature genes (ISGs) in biopsy tissue from patients with EoE, but the specific cell types that contribute to this IFN response and the effect of interferons on the esophageal epithelium remain incompletely understood. Here, we use single-cell RNA sequencing (scRNA-seq) to examine the expression of IFN and ISGs during EoE and explore how IFN-α and IFN-γ treatments affect epithelial function.

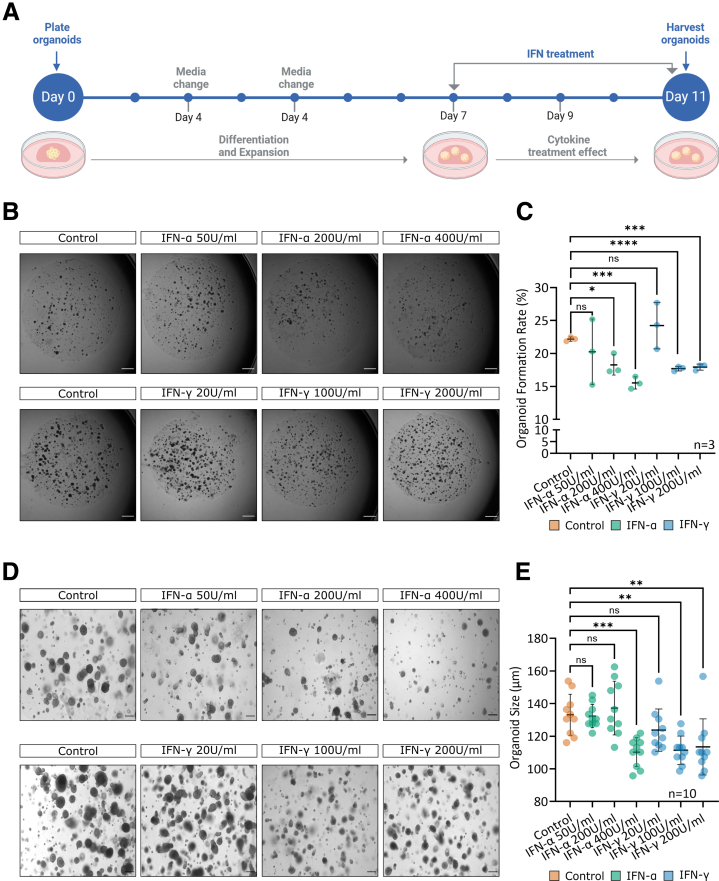
Methods: Epithelial gene expression from patients with EoE was examined using scRNA-seq and a confirmatory bulk RNA-seq experiment of isolated epithelial cells. The functional impact of IFN-α and IFN-γ on epithelial cells was investigated using organoid models.

Results: Using scRNA-seq, the highest number of differentially regulated ISGs was found in the epithelial cells of patients with active EoE, and ISGs in transitional epithelial cells correlated significantly with eosinophil counts and endoscopic reference scores. IFN-γ and IFN-α treatments reduced organoid formation rate and size in a dose-dependent manner, with IFN-γ showing a more pronounced impact on measures of epithelial barrier formation and induction of caspase activity. We identify high IFNG expression in a cluster of majority CD8+ T cells with high expression of CD69 and FOS.

Conclusions: These findings reveal that interferon, especially IFN-γ, plays a central role in epithelial cell dysfunction, significantly affecting gene expression, cellular differentiation, and barrier integrity. Clarifying the contribution of varied cytokine signals in EoE may help explain the heterogeneity in patient presentation and therapeutic response.

Keywords: Apoptosis; Barrier Integrity; Eosinophilic Esophagitis; Epithelial Differentiation; Interferon Response.


Figures

None
Graphical abstract
Figure 1
Figure 1
Single-cell analysis of interferon response signature genes in esophageal EoE biopsy samples. (A) UMAP and (B) marker genes of clusters identified in the single-cell analysis of esophageal biopsy tissue from Morgan et al (GSE175930) with n = 10,049 cells for active disease and 4194 cells for remission. (C) Scaled expression and frequency of IFN- γ, IFN-ɑ, and shared ISGs from single cell analysis of active disease in the esophagus. Gene sets were identified between adult and pediatric EoE and control biopsy tissue in Ruffner et al.IFNA1 and IRF9 were not identified in this dataset, and IFNL1 was identified in <10% of cells in each cluster. (D) Volcano plots displaying differentially expressed ISGs between active and remission states in selected scRNA-seq cell clusters. The thresholds for differential expression were set at FDR-adjusted P < .05 and -.25 > log2FC > .25. Clusters without differential expression of ISGs were excluded.
Figure 2
Figure 2
Epithelial IFN-α and IFN-γ responses correlate with histologic and endoscopic activity in EoE. (A) UMAP and (B) marker genes of epithelial cell clusters from active and remission patients with EoE, annotated based on their cell type identities: quiescent cells (KRT15), proliferating basal cells (MKI67), early transitioning cells (PCNA), late transitioning cells (KRT6B), and other epithelial markers. (C) Violin plot showing the distribution of Hallmark IFN-α response genes (left) and Hallmark IFN-γ response genes (right) in epithelial cells from patients with EoE. (D) Violin plot of the distribution of Hallmark IFN-α response genes (left) and Hallmark IFN-γ response genes (right) across different epithelial cell clusters. Statistical significance is indicated by Ps: ∗∗∗∗P < .0001; ∗∗∗P < .001; ∗∗P < .01; ∗P < .05. (E) Correlation between mean IFN-α and IFN-γ response module score and median eosinophil count in esophageal tissue by epithelial cluster. (F) Correlation between mean IFN-α and IFN-γ response module score and the EREFS by epithelial cluster.
Figure 3
Figure 3
Esophageal epithelium expresses IFN response gene signature in active EoE. CD45- epithelial-enriched cell fraction was isolated from active EoE (n = 10) and control (n = 13) patient biopsies and analyzed by RNA-seq. Using the first 3 components, PCA revealed distinct clustering between EoE and control samples based on gene expression. (B) Heatmap displaying unsupervised hierarchical clustering of EoE active and control samples based on gene expression profiles of the most variable genes. (C) Volcano plot of DEGs in EoE active vs control, CD45-depleted, epithelial cell RNA-seq. (D) GSEA plot showing the running enrichment score and the position of the genes in the ranked list of DEGs of the significant pathways in EoE epithelium compared with control. (E) Circos plot of overlapping DEGs in the significant pathways.
Figure 4
Figure 4
Esophageal epithelial interferon receptor expression and signaling. EPC2-hTERT esophageal epithelial keratinocytes were assessed using flow cytometry, and the (A) gating schematics for assessment of interferon receptor expression are shown. FSC and SSC were used to identify single cells; dead cells were excluded using Zombie amine-reactive live/dead dye, then fluorescence was determined and compared to isotype control-stained cells. (B) Mean fluorescence intensity of IFN-α and IFN-γ receptor subunits on EPC2-hTERT cells (n = 5, mean ± SD). (C) Time course of STAT1 and STAT2 phosphorylation by Western blot in EPC2-hTERT cells. (D) Densitometric analysis of the Western blot bands was performed using ChemiDocTM MP Imaging System, Bio-Rad, and quantified using Image Lab software. (n = 4, mean ± SD). Statistical significance is as follows: ∗∗∗∗P < .0001; ∗∗∗P < .001; ∗∗P < .01; and ∗P < .05.
Figure 5
Figure 5
IFN treatment reduces organoid recovery and size. (A) Schematic depicting the 3D organoid epithelial culture model from Day 1 to 11. Organoid culture recapitulates the intricate architecture, proliferation, and differentiation gradient observed in the human esophageal epithelium. Cytokine stimuli are introduced into the media on Days 7 to 11. The organoid formation rate was (B) measured on Day 11 from phase-contrast images (scale bar = 50 μm), then (C) calculated as the total number of organoids divided by the total number of seeded cells (n = 3 organoids per group, mean ± SD). (D) Representative phase contrast images illustrating organoid size differences (scale bar = 750 μm) on Day 11, which was measured and (E) reported as the mean diameter (n = 10 organoids per group, mean ± SD). Statistical significance is indicated as follows: ∗∗∗∗P < .0001; ∗∗∗P < .001; ∗∗P < .01l and ∗P < .05.
Figure 6
Figure 6
IFN-γ treatment alters organoid morphology and decreases p63+ basal population. (A) Representative images of H&E staining of human esophageal epithelial 3D organoids demonstrate IFN-α and IFN-γ treatment effects on central differentiation. (B) and (C) p63/TP63 IHC at Day 11 to assess basaloid cell content, represented by the percentage of TP63-positive staining (n = 10 organoids per group, mean ± SD). Scale bar = 150 μm in both A & B. Statistical significance is indicated as follows: ∗∗∗∗P < .0001; ∗∗∗P < .001; ∗∗P < .01; and ∗P < .05.
Figure 7
Figure 7
IFN-treated organoids display accelerated proliferation and differentiation. Organoids were treated with IFN-α 200 U/mL or IFN-γ 100 U/mL then collected for staining at Day 7 (4 hours post-cytokine treatment), Day 9 (48 hours post-treatment), and Day 11 (96 hours post-treatment). Organoids were stained for (A, B) pSTAT-1 to examine the pattern of activation, (C, D) Ki67 to assess proliferation, and (E, F) IVL to assess epithelial differentiation. Scale bar = 150 μm. Quantification was performed on 10 organoids per condition, mean ± SD is shown. Statistical significance is indicated as follows: ∗∗∗∗P < .0001; ∗∗∗P < .001; ∗∗P < .01; and ∗P < .05.
Figure 8
Figure 8
IFN-γ treatment in vitro replicates the in vivo IFN-γ response (A) PCA separates IFN-γ treated organoids and IFN-α treated and unstimulated organoids based on gene expression profiles using the first 3 principal components. (B) Volcano plot showing differential gene expression in IFN-γ treated organoids vs unstimulated organoid cultures. (C) Venn diagram illustrating the overlap of upregulated (red) and downregulated (blue) genes shared between EoE epithelial cells (active vs control), IFN-α-, and IFN-γ-treated organoids at FDR < .05 and log2FC ≥ ∣1∣.
Figure 9
Figure 9
IFN-γ treatment in vitro changes the expression of a subset of genes relevant to esophageal biology. (A) Venn diagram of overlapping upregulated and downregulated genes in IL-13 obtained from Hara T et al, and IFN-γ-treated organoids were compared with 429 esophagus-specific genes. The esophagus-specific gene list was derived from the Human Protein Atlas, which are expressed 4-fold higher in the esophagus than other tissue types. This analysis was performed to assess how many esophagus-specific genes are affected by each type of cytokine treatment. (B) The ridge plot shows the running enrichment score of 14 pathways with positive enrichment scores and 10 pathways with negative enrichment scores in IFN-γ treated organoids and adjusted P < .05.
Figure 10
Figure 10
IFN-γ treatment alters epithelial apical junction gene expression and tight junction protein localization in esophageal epithelial organoids. (A) Hierarchical clustering based on the leading edge of the positively enriched pathway, HALLMARK_APICAL_JUNCTION; heatmap showing gene expression levels across IFN-γ- and IFN-α-treated and unstimulated organoids. (B) IHC of tight junction proteins, claudin 1 and occludin in 3D organoids derived from EPC2-hTERT cells treated with IFN-α and IFN-γ.
Figure 11
Figure 11
IFN-γ treatment disrupts epithelial barrier function in ALI epithelial cultures model. (A) Schematic of the ALI epithelial culture model. Culture on Days 1 to 7 facilitates proliferation and initial differentiation, followed by Days 7 to 10, which support terminal differentiation. External stimuli are introduced into the basolateral media chamber from Days 10 to 14, enabling the evaluation of their impact on epithelial barrier function. (B) TEER of ALI and (C) translocation of 70kDa FITC-dextran across ALI were assessed (n = 6 wells per group, mean ± SD). (D) Representative images of H&E staining of IFN-α and IFN-γ treatment effects on ALI cultures. Statistical significance is indicated as follows: ∗∗∗∗P < .0001; ∗∗∗P < .001; ∗∗P < .01; and ∗P < .05.
Figure 12
Figure 12
IFN-γ treatment potentiates cytotoxicity in esophageal epithelium. (A) Hierarchical clustering based on the leading edge of the positively enriched pathway, HALLMARK_APOPTOSIS; heatmap showing gene expression levels across IFN-γ- and IFN-α-treated and unstimulated organoids. (B) Caspase-3 and caspase-8 activity was assessed in EPC2-hTERT cells treated with IFN-α and IFN-γ (n = 12 replicates, mean ± SD). (C) MTT assay was used to determine the effect of IFN treatments on cell viability (n = 12 replicates, mean ± SD). (D) Representative IHC for cleaved caspase-3 in the esophageal epithelium of EoE active and control subjects. Scale bar = 200 μm. The inset table indicates patients’ sex, age, and the peak eosinophil count per hpf. (E) The percentage of caspase-3-positive staining from patient biopsies was quantified. Mean and standard deviation are shown; each point represents a patient sample. Statistical significance is indicated as follows: ∗∗∗∗P < .0001; ∗∗∗P < .001; ∗∗P < .01; and ∗P < .05.
Figure 13
Figure 13
Single-cell analysis reveals activated CD8+ T cells as the main source of IFN-γ and upregulated IFN-γ receptors in eosinophils during active disease. (A) UMAP and (B) marker genes of clusters identified in single-cell data of T cells obtained from esophageal biopsy tissue. The clusters are identified based on the expression of marker genes, with a total of 3067 cells for active disease and 1357 cells for remission analyzed. (C) Dot plot of IFN signaling genes for each cell type in the esophagus displaying average expression and frequency of expression for each gene. (D) Scaled expression and frequency of IFNG in esophageal T cells separated by disease state. (E) Volcano plot comparing gene expression in CD8+ Trm1 and CD8+ Trm2 cells. Immune-specific genes, including CD8+ Trm2 markers IFNG, CD69, and FOS, are highlighted in red, and non-significant genes are shown in gray. Trm, Tissue-resident memory; peTh2, pathogenic effector Th2.

Update of

References

    1. Spergel J., Aceves S.S. Allergic components of eosinophilic esophagitis. J Allergy Clin Immunol. 2018;142:1–8. - PMC - PubMed
    1. Dellon E.S., Rothenberg M.E., Collins M.H., et al. Dupilumab in adults and adolescents with eosinophilic esophagitis. N Engl J Med. 2022;387:2317–2330. - PubMed
    1. Simon D., Cianferoni A., Spergel J.M., et al. Eosinophilic esophagitis is characterized by a non-IgE-mediated food hypersensitivity. Allergy. 2016;71:611–620. - PubMed
    1. Dellon E.S., Liacouras C.A., Molina-Infante J., et al. Updated International Consensus Diagnostic Criteria for Eosinophilic Esophagitis: Proceedings of the AGREE Conference. Gastroenterology. 2018;155:1022–1033.e10. - PMC - PubMed
    1. Blanchard C., Stucke E.M., Rodriguez-Jimenez B., et al. A striking local esophageal cytokine expression profile in eosinophilic esophagitis. J Allergy Clin Immunol. 2011;127:208–217. 217.e1–7. - PMC - PubMed

MeSH terms