. 2025 Jan 30;15(1):7.
doi: 10.1038/s41408-025-01213-z.

GATA2 mutated allele specific expression is associated with a hyporesponsive state of HSC in GATA2 deficiency syndrome

Affiliations

GATA2 mutated allele specific expression is associated with a hyporesponsive state of HSC in GATA2 deficiency syndrome

Laetitia Largeaud et al. Blood Cancer J. .

Abstract

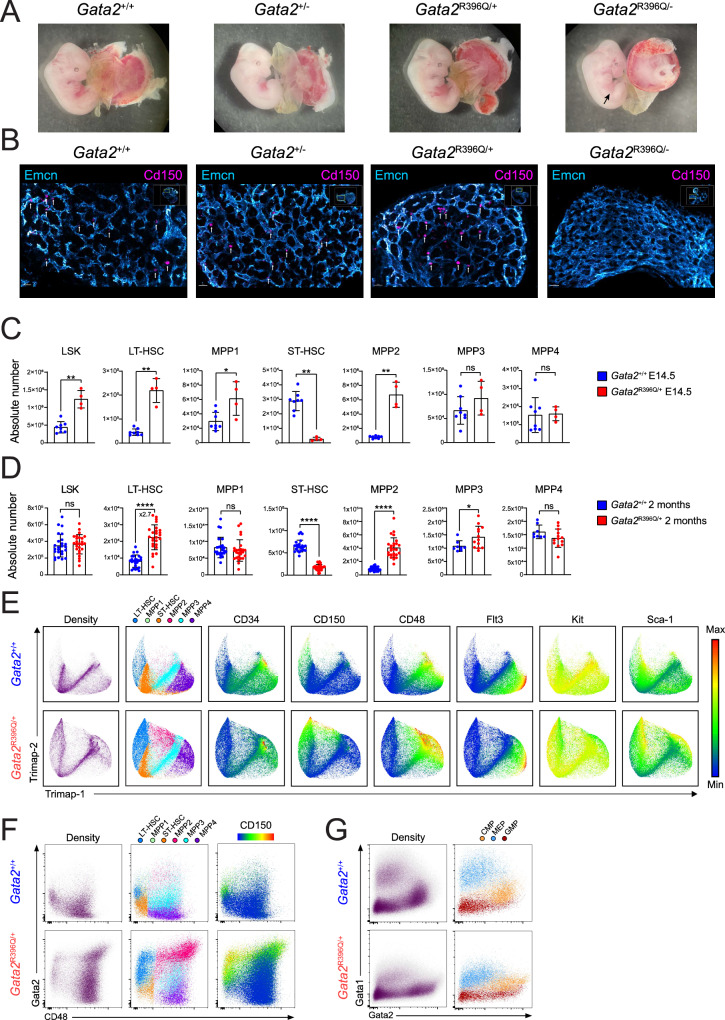
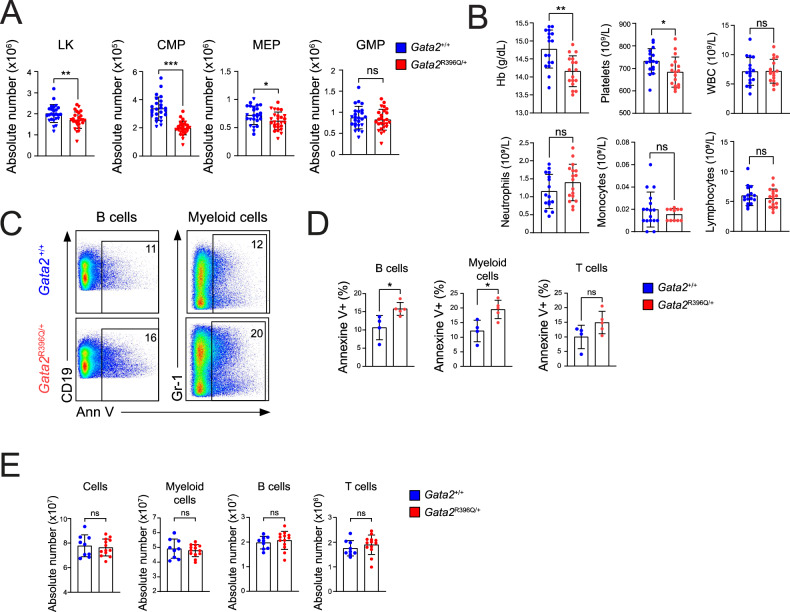
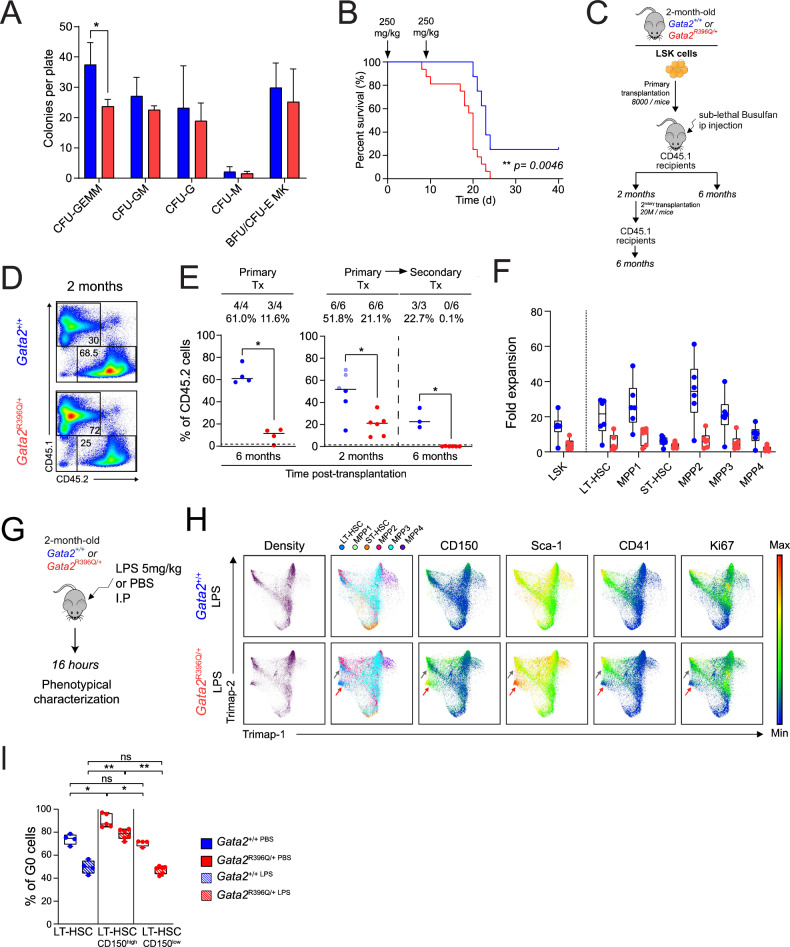
GATA2 germline mutations lead to a syndrome characterized by immunodeficiency, vascular disorders and myeloid malignancies. To elucidate how these mutations affect hematopoietic homeostasis, we created a knock-in mouse model expressing the recurrent Gata2 R396Q missense mutation. Employing molecular and functional approaches, we investigated the mutation's impact on hematopoiesis, revealing significant alterations in the hematopoietic stem and progenitor (HSPC) compartment in young age. These include increased LT-HSC numbers, reduced self-renewal potential, and impaired response to acute inflammatory stimuli. The mature HSPC compartment was primarily affected at the CMP sub-population level. In the mutant LT-HSC population, we identified an aberrant subpopulation strongly expressing CD150, resembling aging, but occurring prematurely. This population showed hyporesponsiveness, accumulated over time, and exhibited allele-specific expression (ASE) favoring the mutated Gata2 allele, also observed in GATA2 mutated patients. Our findings reveal the detrimental impact of a Gata2 recurrent missense mutation on the HSC compartment contributing to its functional decline. Defects in the CMP mature compartment, along with the inflammatory molecular signature, explain the loss of heterogeneity in HPC compartment observed in patients. Finally, our study provides a valuable model that recapitulates the ASE-related pathology observed in GATA2 deficiency, shedding light on the mechanisms contributing to the disease's natural progression.


Conflict of interest statement

Competing interests: The authors declare no competing interests.

Figures

Fig. 1
Fig. 1. Impaired emergence and differentiation of hematopoietic cells due to recurrent Gata2R396Q mutation.
A Images of E12.5 embryos resulting from Gata2+/- x Gata2R396Q/+ mating. B Immunostaining of fetal liver sections, with Endomucin (Emcn) in blue and CD150 in purple. Scale bar represents 40 µm. The insert shows the fetal liver in its entirety and the location from which the magnification was performed. C Absolute number of indicated population in E14.5 fetal liver of Gata2+/+ (blue, n = 8) and Gata2R396/+ (red, n = 4) embryos. D Absolute number of LSK, LT-HSC, MPP1, ST-HSC, MPP2 (n = 25), MPP3 and MPP4 (n = 8 Gata2+/+, n = 13 Gata2R396Q/+) cells in 2-month-old Gata2+/+ (blue) and Gata2R396Q/+ (red) mice. E TriMap representation of FACS analyses of LSK subpopulations from 2-month-old mice, showing population density and colored scaled indicated marker intensity. F, G Dot plots showing intracellular Gata1 and Gata2 protein expression in subpopulations of Gata2+/+ and Gata2R396Q/+ LSK and LK cells (n = 3) CD150 marker intensity is color-coded. LSK: Lineage- Sca-1+ Kit+ cells LK : Lineage- Sca-1- Kit+ LT Long term, ST Short term, HSC Hematopoietic stem cell, MPP Multipotent progenitor. Each dot represents an individual mouse. Results are shown as mean ± SD; ns not significant, *p < 0.05, **p < 0.01, ***p < 0.001, ****p < 0.0001.
Fig. 2
Fig. 2. Impact of the mutant on hematopoietic differentiated compartment.
A FACS analysis statistics of the absolute number of indicated cells in the bone marrow of 2-month-old Gata2+/+ (blue, n = 25) and Gata2R396/+ (red, n = 25) mice. B Blood parameters, including hemoglobin level (Hb) and white blood cells (WBC), in 2-month-old Gata2+/+ (blue, n = 17) and Gata2R396/+ (red, n = 11) mice. C Representative FACS dot plot of the percentage of Annexin V positive cells in B (CD19+) or myeloid (Gr-1+) cells. D FACS analysis statistics of Annexin V positive cells in the myeloid, B, and T compartment. E FACS analysis statistics of the absolute number of total cells, Myeloid cells, B cells, and T cells in the bone marrow of 2-month-old Gata2+/+ (blue, n = 9) and Gata2R396/+ (red, n = 13) mice. Hb: Hemoglobin level, WBC: white blood cells. LK Lineage- Kit+ cells; CMP Common myeloid progenitor, MEP Megakaryocyte–erythroid progenitor, GMP Granulocyte-monocyte progenitor. Each dot represents an individual mouse. Results are shown as mean ± SD (except (E), SEM); ns not significant, *p < 0.05, **p < 0.01, ***p < 0.001, ****p < 0.0001.
Fig. 3
Fig. 3. Hyporesponsiveness and exhaustion signatures in mutated LSK cells.
A Experimental workflow schematic. B, C Ranked sorted motifs based on differential accessibility: Repressed motifs (B) and enriched motifs (C) in Gata2R396Q/+ LSK cells. D ATAC sequencing signal at the GATA or Erg/Fli1 sites. The color scale represents differential accessibility between Gata2R396Q/+ and Gata2+/+ conditions. The signals are clustered based on their type: more accessible in Gata2R396Q/+, less accessible, or a mix of the two. The top panel shows the footprint of average accessibility at these sites. E Pie charts illustrating the distribution of ATAC-seq consensus peaks relative to gene features for each cluster defined in Fig. 3D. F, G Heatmap of over-represented analysis (ORA) biological processes in Gata2R396Q/+ versus Gata2+/+ cells based on ATAC (F) or RNA (G) sequencing analysis. The color scale represents the enrichment or depletion of each process (-log(p-value)).
Fig. 4
Fig. 4. Molecular profiling reveals dysregulated pathways and gene expression patterns in Gata2R396Q/+ hematopoietic stem and progenitor cell subpopulations.
A Expression of the wild-type Gata2 (plain square) or Gata2R396Q allele (hatched square) in Gata2R396Q/+ (red) versus Gata2+/+ (blue) LT-HSC, ST-HSC, and MPP3-4 subpopulations of LSK cells. Results are shown as mean ± SD; *q-val<0.01. B MA-plots illustrating Log2 fold difference relative to normalized read counts for RNA-sequencing reads, depicting significantly increased (red), significantly decreased (blue), or unchanged (grey) expression in Gata2R396Q/+ versus Gata2+/+ LT-HSC (left panel), ST-HSC (middle panel), and MPP3-4 (right panel) subpopulations of LSK cells. C Expression of indicated genes in Gata2+/+ (blue) or Gata2R396Q/+ (red) LT-, ST-HCS and MPP3 cells. Results are shown as mean ± SD; *q-val<0.01. D Gene set enrichment analysis (GSEA) of enriched or depleted Gene Ontology (GO) terms for LT-, ST-HSC, and MPP3-4 cells, represented by a color scale of normalized enrichment score (NES). False discovery rates (FDR) < 0.05 are indicated by bold-framed squares. E GSEA-enrichment plots showed significant depletion of MolO and NoMO signatures [33] in LT-HSC form Gata2R396Q/+ mice. F, G Expression of indicated genes (from the MolO (F) and NoMO (G) signature), in Gata2+/+ (blue) or Gata2R396Q/+ (red) LT-HSCs. (H) Expression of non-hematopoietic related genes. Results are shown as mean ± SD.
Fig. 5
Fig. 5. Functional characterization of hematopoietic stem cells in Gata2R396Q/+ mice under challenging conditions.
A Clonogenic assay on 2-month-old Gata2+/+ (blue) and Gata2R396Q/+ (red) Lin-Sca-1+Kit+ (LSK) cells. Colonies were counted after 10 days (n = 3). B Kaplan-Meier survival curve (in days) of Gata2+/+ (blue, n = 8) and Gata2R396Q/+ (red, n = 16) mice after two injections (arrows) of 5-fluorouracil (5-FU) (C) Experimental scheme for transplantation assays. D Representative flow cytometry density plot showing bone marrow engrafted cells (CD45.2+) from Gata2+/+ and Gata2R396Q/+ mice versus host cells (CD45.1+) two months after the first engraftment. E Engraftment quantification of donor CD45.2+ cells six (left panel) and two (left part of the right panel) months after transplantation. The number of engrafted mice ( > 1% of CD45.2+) out of the total number of transplanted mice and the average reconstitution percentage for each group are indicated on top of the graph. The far-right panel shows the percentage of CD45.2+ cells 6 months after a secondary transplant of cells from mice indicated with dark-colored dots. Each blue dot represents an individual Gata2+/+ mouse, and red dots represent Gata2R396Q/+ mice. F Fold expansion between the number of estimated engrafted cells and the number recovered 2 months after engraftment for Gata2+/+ (blue) and Gata2R396Q/+ (red) cells G Experimental scheme of LPS injection assay. H TriMap visualization of bone marrow cells from PBS- or LPS- injected 2-month-old Gata2+/+ (bleu) and Gata2R396Q/+ (red) mice depicting HSPC subpopulations, population density and CD150, Sca-1, CD41 and Ki67 marker intensity of on each population. Intensity of each marker is shown using a colored scale. I Percentage of cells in G0 (Ki67- cells) of total LT-HSC in Gata2+/+ (blue) or CD150high and CD150low LT-HSCs in Gata2R396Q/+ (red) mice injected with PBS (plain box) or LPS (hatched box). CFU Colony forming unit, GEMM Granulocyte, erythroid, macrophage, megakaryocyte, GM Granulocyte, macrophage, M Macrophage, G Granulocytes and BFU-E Burst-forming unit erythrocytes. E erythrocyte, Mk megakaryocyte. LSK Lineage- Sca-1+ Kit+ cells, LT, Long term, ST Short term, HSC Hematopoietic stem cell, MPP Multipotent progenitor. LPS Lipopolysaccharide. Results are shown as mean ± SD; ns not significant, *p < 0.05, **p < 0.01, ***p < 0.001, ****p < 0.0001.
Fig. 6
Fig. 6. Functional decline of HSPC in older Gata2R396Q/+ mice.
A Absolute number of LSK, LT-HSC, MPP1, ST-HSC, MPP2, MPP3, and MPP4 cells in 12-month-old Gata2+/+ (blue, n = 9) and Gata2R396/+ (red, n = 10) mice. B Comparison of the absolute number of LT-HSC in the bone marrow of 2- and 12-month-old Gata2+/+ (blue, n = 9) and Gata2R396/+ (red, n = 10) mice. Fold increase between 2 and 12 months is indicated. C Time course of hemoglobin level (Hb) and platelet number in the blood of Gata2+/+ (blue) and Gata2R396/+ (red) mice. D Hallmark-term analysis of gene sets enriched in young Gata2+/+ LT-HSCs versus 20-month-old Gata2+/+ LT-HSC cells, with normalized enrichment scores (NES) shown for significant pathways (FDR < 0.05). E GSEA enrichment plots for interferon response and heme metabolism comparing Gata2R396Q/+ to Gata2+/+ LT-HSC (left panels) and old LT-HSC versus young LT-HSC (right panels). F TriMap visualization of FACS analyses of the different LSK subpopulations showing the population density and the intensity of the CD150, CD41 and CD61 markers on each population following a colored scale. G Statistics of absolute number of CD41/CD61 double positive (CD41+/CD61+) or CD41-/CD61-/low LT-HSCs. H Variant allelic frequency at RNA level (VAFRNA) of Gata2 R396Q mutation on sorted CD150low and CD150high LT-HSCs from 2- and 12-month-old mice. I Analysis of CD45.2 cells percentage after 1 month. 500 CD45.2 LT-HSCs from Gata2+/+ mice (2-month-old mice n = 3, blue), Gata2R396Q/+ mice (2-month-old: red circles (CD150high: black box), 12-month-old: red triangle (CD150high: black box)) were transplanted in CD45.1 recipient mice. J Genomic analysis of one GATA2 deficient patient diagnosed with AML. Circos plot with structural variations (left panel). Visualization on IGV viewer of the variant allele frequency (VAF) after Whole Genome Sequencing (WGS) of infiltrated bone marrow (first line) and healthy tissue (third line) or Whole Exome Sequencing of infiltrated bone marrow (second line). VAF at the RNA level is visualized after RNA-Seq analysis (last line). Results are shown as mean ± SD; *p < 0.05, **p < 0.01, ***p < 0.001, ****p < 0.0001.

References

    1. Crispino JD, Horwitz MS. GATA factor mutations in hematologic disease. Blood. 2017;129:2103–10. - PMC - PubMed
    1. de Pater E, Kaimakis P, Vink CS, Yokomizo T, Yamada-Inagawa T, van der Linden R, et al. Gata2 is required for HSC generation and survival. J Exp Med. 2013;210:2843–50. - PMC - PubMed
    1. Tsai F-Y, Keller G, Kuo FC, Weiss M, Chen J, Rosenblatt M, et al. An early haematopoietic defect in mice lacking the transcription factor GATA-2. Nature. 1994;371:221–6. - PubMed
    1. Soukup AA, Zheng Y, Mehta C, Wu J, Liu P, Cao M, et al. Single-nucleotide human disease mutation inactivates a blood-regenerative GATA2 enhancer. J Clin Invest. 2019;129:1180–92. - PMC - PubMed
    1. Rodrigues NP. Haploinsufficiency of GATA-2 perturbs adult hematopoietic stem-cell homeostasis. Blood. 2005;106:477–84. - PubMed

Publication types

LinkOut - more resources