. 2025 Jan 30;16(1):1182.
doi: 10.1038/s41467-025-56449-x.

Metagenomic global survey and in-depth genomic analyses of Ruminococcus gnavus reveal differences across host lifestyle and health status

Affiliations

Metagenomic global survey and in-depth genomic analyses of Ruminococcus gnavus reveal differences across host lifestyle and health status

S Nooij et al. Nat Commun. .

Abstract

Ruminococcus gnavus is a gut bacterium found in > 90% of healthy individuals, but its increased abundance is also associated with chronic inflammatory diseases, particularly Crohn's disease. Nevertheless, its global distribution and intraspecies genomic variation remain understudied. By surveying 12,791 gut metagenomes, we recapitulated known associations with metabolic diseases and inflammatory bowel disease. We uncovered a higher prevalence and abundance of R. gnavus in Westernized populations and observed bacterial relative abundances up to 83% in newborns. Next, we built a resource of R. gnavus isolates (N = 45) from healthy individuals and Crohn's disease patients and generated complete R. gnavus genomes using PacBio circular consensus sequencing. Analysis of these genomes and publicly available high-quality draft genomes (N = 333 genomes) revealed multiple clades which separated Crohn's-derived isolates from healthy-derived isolates. Presumed R. gnavus virulence factors could not explain this separation. Bacterial genome-wide association study revealed that Crohn's-derived isolates were enriched in genes related to mobile elements and mucin foraging. Together, we present a large R. gnavus resource that will be available to the scientific community and provide novel biological insights into the global distribution and genomic variation of R. gnavus.


Conflict of interest statement

Competing interests: JN is an employee of Vedanta Biosciences Inc. The other authors report no competing interests.

Figures
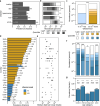
Fig. 1
Fig. 1. Intestinal colonization with R. gnavus is associated with age, health, geography, and lifestyle.
a We queried the public resource curatedMetagenomicData for relative abundances of R. gnavus in human stools to conduct a meta-analysis of global prevalence and abundance. Prevalence is shown as fraction of subjects with R. gnavus abundance > 0, grouped by selected health conditions. IBD: inflammatory bowel diseases, T2D: type-2 diabetes, ACVD: atherosclerotic cardiovascular diseases. Each disease group is compared to healthy using logistic regression. IBD: p < 2.2 × 10−16; hypertension: p = 0.00127; T2D: p = 1.52 × 10−9; ACVD: p < 2.2 × 10−16. b Relative abundance of R. gnavus in the same groups as (a) shown as quantile plots, using quantiles ranging from 0 to 100% in increments of 10 with the median shown as a thick black line and quantiles closer to the median shown as darker shades of the same color (see “Methods”). Each disease is compared to healthy using linear regression. IBD: p < 2.2 × 10−16; hypertension: p = 0.399; T2D: 1.9 × 10−10; ACVD: p < 2.2 × 10−16. c Comparison of R. gnavus abundance between healthy people from Westernized and non-Westernized societies as quantile plot. P < 2.2 × 10−16, calculated using linear regression. d Prevalence of R. gnavus grouped per country and colored by Westernization, only showing results from countries from which at least 50 samples were collected. (Countries are abbreviated by ISO 3166-1 alpha-3 codes.) e Sequencing depth control per country (same as d). Each diamond represents a study that collected samples from the corresponding country. Sequencing depth is shown as median number of reads generated per country in the study. f Relative abundance of R. gnavus in different age categories (newborn: < 1 year, child: 1-11 years, school age: 12–18 years, adult: 19-65, senior: 65+ years) shown as quantile plots. Age categories are listed in g. Each age category is compared to adult using linear regression. Newborn: p < 2.2 × 10−16; child: p < 2.2 × 10−16; schoolage: p = 0.0164; senior: p = 1.37 × 10−6. g Prevalence of R. gnavus among different age categories. Each category is compared to adult using logistic regression. Newborn: p = 1.14 × 10⁻⁶; child: p < 2.2 × 10−16; schoolage: p = 0.0797; senior: p = 2.92 × 10−4. *** p < 0.001, ** p < 0.01, * p < 0.05, n.s. not significant. In (b, c, and f) a pseudocount of 1.3 × 10−5 is added to all abundances to enable visualization on a logarithmic scale. Source data are provided as a Source Data file.
Fig. 2
Fig. 2. Newly generated complete genomes have superior assembly characteristics and cover phylogenetic diversity.
a We collected both publicly available short-read-based genomes from isolates and metagenome-assembled genomes (MAG), as well as long-read genomes generated from isolates in this study using PacBio HiFi sequencing and compared them to the one reference genome from NCBI GenBank (accession number GCF_009831375.1). Assembly statistics of each group of genomes are compared to the reference genome, shown as dashed line. Thick lines indicate medians, boxes represent first and third quantile and whiskers indicate the rest of the data excluding outliers; outliers are shown as separate dots. Color legend is shared with (c). b Length and circularity of de novo assembled contigs from PacBio HiFi reads. c Maximum likelihood phylogenetic tree based on concatenated core genes. Each genome is annotated with its corresponding genome source and continent of origin. Stars mark genomes sequenced with PacBio newly added in this work. The gray shaded area marks the infant-associated clade that contains 8/10 MAGs with flagellum genes. Source data are provided as a Source Data file.
Fig. 3
Fig. 3. Genomic differences between isolates from healthy and Crohn’s indicates a Crohn’s-specific subspecies.
a Using our newly generated PacBio genomes, we compared genomes of isolates from healthy people to isolates from CD patients. Maximum likelihood phylogenetic tree of PacBio isolate genomes using concatenated core genes, with annotation of disease status and genes and gene clusters described previously in literature. Asterisks indicate gene clusters from genomes that are highlighted in Supplementary Fig. 9. Below are heatmaps of pairwise average nucleotide identity (ANI) and accessory genome similarity (calculated as 1 / binary distance). SA: superantigen (2 genes), IP: inflammatory polysaccharide (23 genes, ‘partial’ = 20 or 21 genes), cps: capsular polysaccharide (20 genes), nan: sialic acid metabolic cluster (11 genes, ‘partial’ = 6 genes), TD: tryptophane decarboxylase (1 gene), sd-XHD: selenium-dependent xanthine dehydrogenase (1 gene), bilR: bilirubin reductase (1 gene). b Comparison of genome comparison metrics core genome phylogenetic distance, average nucleotide identity and accessory genome binary distance tested with Spearman correlations. P < 2.2 × 10−16. c Comparison of core and accessory genome size between deduplicated isolate genomes with a CD or healthy phenotype, derived from short-read or long-read sequencing. Box plots represent median values with first and third quartile, whiskers indicate the rest of the data excluding outliers, and overlayed dots (jitter) show individual values. P-values were calculated using two-sided Wilcoxon rank-sum test. Core genome: p = 0.4, accessory genome: p = 0.42. d We compared accessory genomes of isolates from healthy people and CD patients using a bacterial GWAS to identify genes associated with disease phenotype. Results are expressed as false discovery rate-adjusted p-value (using the Benjamini-Hochberg correction) and epsilon, which is a measure of association strength between phenotype and genotype based on the (maximum likelihood) phylogenetic tree. The gray dashed line indicates a p-value of 0.05, anything above the line is considered statistically significant. Positive values of epsilon correspond to an enrichment in CD and negative epsilon values are associated with a healthy host phenotype. P- and epsilon-values are adapted from the synchronous GWAS model as implemented in Hogwash. Source data are provided as a Source Data file.

References

    1. VanEvery, H., Franzosa, E. A., Nguyen, L. H. & Huttenhower, C. Microbiome epidemiology and association studies in human health. Nat. Rev. Genet.24, 109–124 (2023). - PubMed
    1. Hall, A. B. et al. A novel Ruminococcus gnavus clade enriched in inflammatory bowel disease patients. Genome Med.9, 103 (2017). - PMC - PubMed
    1. Grahnemo, L. et al. Cross-sectional associations between the gut microbe Ruminococcus gnavus and features of the metabolic syndrome. Lancet Diab. Endocrinol.10, 481–483 (2022). - PubMed
    1. De Filippis, F. et al. Specific gut microbiome signatures and the associated pro-inflamatory functions are linked to pediatric allergy and acquisition of immune tolerance. Nat. Commun.12, 5958 (2021). - PMC - PubMed
    1. Wirbel, J., Essex, M., Forslund, S. K. & Zeller, G. Evaluation of microbiome association models under realistic and confounded conditions. bioRxiv10.1101/2022.05.09.491139 (2022).

Supplementary concepts

LinkOut - more resources