. 2025 Jan 30;16(1):1165.
doi: 10.1038/s41467-025-56468-8.

Phase separation of a microtubule plus-end tracking protein into a fluid fractal network

Affiliations

Phase separation of a microtubule plus-end tracking protein into a fluid fractal network

Mateusz P Czub et al. Nat Commun. .

Abstract

Microtubule plus-end tracking proteins (+TIPs) participate in nearly all microtubule-based cellular processes and have recently been proposed to function as liquid condensates. However, their formation and internal organization remain poorly understood. Here, we have study the phase separation of Bik1, a CLIP-170 family member and key +TIP involved in budding yeast cell division. Bik1 is a dimer with a rod-shaped conformation primarily defined by its central coiled-coil domain. Its liquid condensation likely involves the formation of higher-order oligomers that phase separate in a manner dependent on the protein's N-terminal CAP-Gly domain and C-terminal EEY/F-like motif. This process is accompanied by conformational rearrangements in Bik1, leading to at least a two-fold increase in multivalent interactions between its folded and disordered domains. Unlike classical liquids, Bik1 condensates exhibit a heterogeneous, fractal supramolecular structure with protein- and solvent-rich regions. This structural evidence supports recent percolation-based models of biomolecular condensates. Together, our findings offer insights into the structure, dynamic rearrangement, and organization of a complex, oligomeric, and multidomain protein in both dilute and condensed states. Our experimental framework can be applied to other biomolecular condensates, including more complex +TIP networks.


Conflict of interest statement

Competing interests: The authors declare no competing interests.

Figures
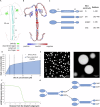
Fig. 1
Fig. 1. Structural organization and phase separation of Bik1.
A One possible structure of the Bik1 dimer as predicted by AlphaFold (for alternative predicted structures, see Supplementary Fig. 1A) with color-coded domains. The three predicted coiled-coil segments A, B, and C of the coiled-coil domain, which are separated by linkers are indicated. B Charge distribution on Bik1’s surface. Positively charged patches are colored in blue, negatively charged patches are in red, and neutral patches are in light gray. C Bik1 truncation mutants used in this study with their respective designations and residue boundaries. CG, CAP-Gly domain; L1 and L2, linker regions 1 and 2; FL, full-length Bik1; ΔN, Bik1 variant lacking the N-terminal CAP-Gly domain and the linker L1; ZnF, zinc finger; QQFF, peptide Gln-Gln-Phe-Phe; ΔNC, Bik1 variant lacking both the N- and C-terminal regions and corresponding to Bik1’s coiled-coil domain. D Phase diagram of N-terminally His-tagged Bik1 FL in 20 mM Tris-HCl, pH 7.4, supplemented with 1 mM DTT and 10% glycerol. E Confocal fluorescence microscopy images of micrometer-sized droplets observed for 40 µM Bik1 (mixture of 90% Bik1 FL and 10% mNG-Bik1 FL; both proteins are N-terminally His-tagged) in a buffer consisting of 20 mM Tris-HCl, pH 7.4, supplemented with 250 mM NaCl and 2% glycerol. View from the top (left) and a mid-plane slice (right). F The average intensity (N = 233) of mNG throughout mNG-Bik1 FL droplets is shown in (E). Error bars represent standard errors. G Possible inter-molecular interactions between Bik1 dimers mediated by the protein’s N-terminal CAP-Gly domain and C-terminal EEY/F-like motif. Unstructured regions of the protein are shown as blue solid lines. CAP-Gly, coiled coil, and zinc-finger domains are depicted in the same way as in (C). Source data of D and F are provided in the Source Data file.
Fig. 2
Fig. 2. SEC-SAXS analysis of Bik1 variants.
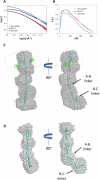
A Representative scattering profiles obtained for Bik1 FL, Bik1 ΔQQFF, and Bik1 ΔNC in a high-salt buffer (20 mM Tris-HCl, pH 7.5, supplemented with 500 mM NaCl, 2% glycerol, and 1 mM DTT). Solid black lines represent fits of the generated Bik1 models (shown in C and D and Supplementary Fig. 4) to the experimental data. B Representative distance distribution functions obtained for Bik1 FL, Bik1 ΔQQFF, and Bik1 ΔNC. C A DAMMIF-generated molecular envelope (beads model) of Bik1 FL superimposed with its AlphaFold predicted model shown in Fig. 1A and adjusted to fit the beads model. D The molecular envelope of Bik1 ΔNC superimposed with the Bik1 AlphaFold model truncated to the coiled coil and adjusted to fit the beads model. Two kinks suggested by the shape of the calculated envelope are marked with black arrows. See also Supplementary Fig. 4.
Fig. 3
Fig. 3. Qualitative XL-MS of Bik1 FL.
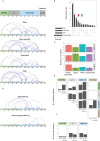
A DSS crosslinks and selflinks (depicted in blue and in red, respectively) identified in dilute (10 mM HEPES, pH 7.5, supplemented with 500 mM NaCl) and phase-separated (5 mM HEPES, pH 7.5, supplemented with 250 mM NaCl) conditions, and after centrifugation of phase-separated condition (fractionations: supernatant and pellet). Crosslinked peptides were filtered based on the quality of the spectra (ld.Score >20 and consistency, requiring identification in at least two out of three independent experimental replicates). Bik1 domains and regions are shown in the top panel: CAP-Gly domain, green; linker regions L1 and L2, light gray; coiled coil, cyan; zinc-finger domain ZF, orange. B Upset plot for filtered DSS crosslinked peptides showing the overlap among the following conditions: dilute, phase separated, supernatant, and pellet. The red and green triangle marks the number of crosslinked peptides shared between the pellet and phase separation and between the dilute and supernatant conditions. C Quantification of filtered DSS crosslinked peptides (monolinks, crosslinks, and selflinks) for the following conditions: dilute, phase separated, supernatant, and pellet. Data are presented as mean values ± SD and each dot represents the results of an independent experiment (N = 3, except for the pellet condition which has no replicates) the bar plot shows the average number across three conditions with the error bars representing the standard deviations of three independent experimental replicates. D PDH crosslinks identified in dilute, phase-separated conditions. Crosslinked peptides were filtered based on the quality of the spectra (ld.Score >25). The plot shows the PDH crosslinked peptides obtained from different protease conditions (AspN, GluC, AspN+GluC, and chymotrypsin). All conditions have been tested without replicates. E Number of identified spectra for crosslinked DSS and PDH peptides associated with Bik1 domains and regions. The bar plot reports the sum of all identified spectra for the dilute and phase-separated conditions. F Number of identified spectra for PDH and DSS monolink peptides associated with the Bik1 domain and regions. The bar plot reports the sum of all identified spectra for the dilute and phase-separated conditions. Source data for all panels are provided in the Source Data file.
Fig. 4
Fig. 4. Quantitative XL-MS of Bik1 variants.
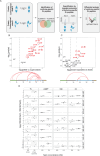
A Quantitative workflow to probe Bik1 conformational changes. Crosslinked (XL) peptides were obtained from Bik1 FL in dilute, phase separation, supernatant, and pellet conditions (Fig. 3A). Crosslinks specific to one condition (conformo-specific crosslinks) are then employed to monitor structural rearrangements in Bik1 samples using quantitative targeted proteomics. B, C Differential abundance levels for conformo-specific crosslinks comparing pellet versus supernatant (B) and phase separation versus dilute (C) conditions. The volcano plot shows the log2 fold changes of crosslinks abundance and their corresponding statistical significance (two-sided unpaired Student’s t-test, N = 3 independent experiments) between the two conditions. Conformo-specific crosslinked peptides with a log2FC > 1 are annotated in red. For domain designations of the Bik1 bar representation, see the top panel in Fig. 3A. D Boxplot showing the abundance of selected crosslinked peptides (Supplementary Table 3) normalized for Bik1 abundance in high or low salt conditions. Each dot represents the result of an independent experiment (N = 3). The boxplot boundaries indicate the first (Q1, 25%) and third (Q3, 75%) quartiles, while the lower and upper whiskers are defined by Q1 − 1.5 IQR and Q3 + 1.5 IQR, respectively. The average value is represented by a line across the center of the box. Data are normalized for the average intensities obtained at high salt concentrations. Source data for (BD) are provided in the Source Data file.
Fig. 5
Fig. 5. SAXS of phase-separated Bik1.
A SAXS measurement (blue curve) with Gaussian-blob fit (red curve) and fit obtained with 50,000 model 3 copies (black curve). The model 3 fit was used to model the fractal structure and is restricted to q > 2π/σw due to the Gaussian window with σw = 1500 Å. The straight blue line above the SAXS measurement represents the I(q)~q2 behavior expected for a fractal network with a fractal dimension of 2. The green curve shows the Bik1 form factor obtained from our SEC-SAXS data (Fig. 2A). Inset, schematic representation of model 3. B Radial distribution function of the centers of 50,000 model 3 copies. The decay for r larger than the nearest-neighbor peak is expected for a fractal network. Inset, two model 3 copies with their centers of mass (dots). The red double arrow highlights the distance r between their centers. C Sections taken from the fractal structure obtained with 50,000 model 3 copies. Source data for all panels are provided in the Source Data file.

References

    1. Akhmanova, A. & Steinmetz, M. O. Control of microtubule organization and dynamics: two ends in the limelight. Nat. Rev. Mol. Cell Biol.16, 711–726 (2015). - PubMed
    1. Komarova, Y. et al. Mammalian end binding proteins control persistent microtubule growth. J. Cell Biol.184, 691–706 (2009). - PMC - PubMed
    1. Bieling, P. et al. CLIP-170 tracks growing microtubule ends by dynamically recognizing composite EB1/tubulin-binding sites. J. Cell Biol.183, 1223–1233 (2008). - PMC - PubMed
    1. Akhmanova, A. & Hoogenraad, C. C. Microtubule plus-end-tracking proteins: mechanisms and functions. Curr. Opin. Cell Biol.17, 47–54 (2005). - PubMed
    1. van der Vaart, B. et al. SLAIN2 links microtubule plus end–tracking proteins and controls microtubule growth in interphase. J. Cell Biol.193, 1083–1099 (2011). - PMC - PubMed

MeSH terms

Substances

LinkOut - more resources