. 2025 Jan 30;16(1):1183.
doi: 10.1038/s41467-025-56420-w.

Stroma-derived Dickkopf-1 contributes to the suppression of NK cell cytotoxicity in breast cancer

Affiliations

Stroma-derived Dickkopf-1 contributes to the suppression of NK cell cytotoxicity in breast cancer

Seunghyun Lee et al. Nat Commun. .

Abstract

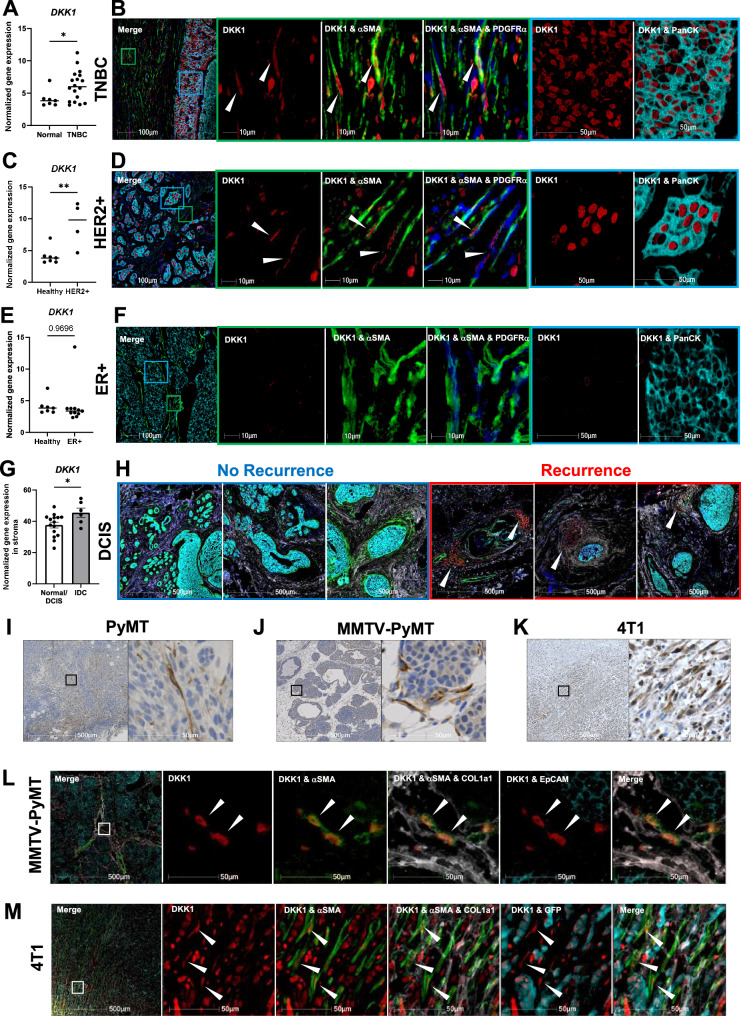
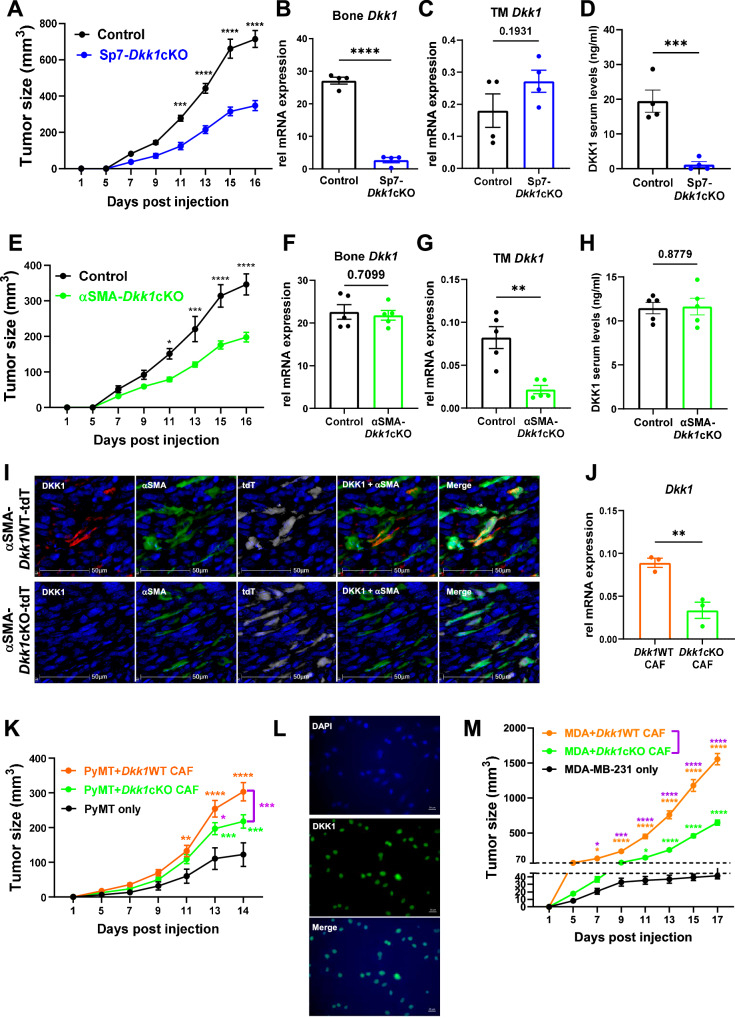
Mechanisms related to tumor evasion from NK cell-mediated immune surveillance remain enigmatic. Dickkopf-1 (DKK1) is a Wnt/β-catenin inhibitor, whose levels correlate with breast cancer progression. We find DKK1 to be expressed by tumor cells and cancer-associated fibroblasts (CAFs) in patient samples and orthotopic breast tumors, and in bone. By using genetic approaches, we find that bone-derived DKK1 contributes to the systemic DKK1 elevation in tumor-bearing female mice, while CAFs contribute to DKK1 at primary tumor site. Systemic and bone-specific DKK1 targeting reduce tumor growth. Intriguingly, deletion of CAF-derived DKK1 also limits breast cancer progression, without affecting its levels in circulation, and regardless of DKK1 expression in the tumor cells. While not directly supporting tumor proliferation, stromal-DKK1 suppresses NK cell activation and cytotoxicity by downregulating AKT/ERK/S6 phosphorylation. Importantly, increased DKK1 levels and reduced cytotoxic NK cells are detected in women with progressive breast cancer. Our findings indicate that DKK1 represents a barrier to anti-tumor immunity through suppression of NK cells.


Conflict of interest statement

Competing interests: The DKK1-neutralizing antibody mDKN01 and relevant IgG control antibody were provided at no cost for this study by Leap Therapeutics. No financial support from Leap Therapeutics was provided to perform this study. M.H. is employed by Leap Therapeutics and owns company stocks. None of the other authors have competing interests in this work.

Figures

Fig. 1
Fig. 1. DKK1 augments breast cancer progression.
A DKK1 serum levels were measured by ELISA in no tumor-bearing (NTB) 6–8 weeks old C57BL/6 WT female mice (n = 5) or 2 weeks after the inoculation of PyMT-BO1 breast cancer cells into the mammary fat pad (MFP; 105 cells, n = 7). B Tumor growth in the MFP was determined by caliper measurements in WT mice inoculated with PyMT-BO1 (n = 5 mice/group) receiving mDKN01 (10 mg/kg) or control IgG antibody i.p. every other day. CF Tumor progression was determined by BLI in mice inoculated intracardiacally with PyMT-BO1 cells (i.c.; 104 cells, albino C57BL/6, n = 9 for IgG, n = 6 for mDKN01) (C, D) or intratibially (i.t.; 104 cells, C57BL/6, n = 6 for IgG, n = 7 for mDKN01) (E, F) followed by administration of mDKN01 or control IgG antibody every other day. G Schematic representation of the therapeutic administration of IgG and mDKN01. H Tumor growth in the MFP was determined by caliper measurements in WT mice inoculated with PyMT-BO1 (n = 5 mice/group) receiving mDKN01 (10 mg/kg) or control IgG antibody i.p. every three days starting 7 days post-tumor inoculation. I DKK1 serum levels were measured by ELISA in 6–8 weeks old female BALB/c WT mice with no tumors (NTB n = 7) or 2 weeks after the inoculation of 4T1 breast cancer cells into the MFP (n = 6). J Primary tumor growth was evaluated by caliper measurements in WT mice inoculated with 4T1 cells (n = 4 mice/group) into the MFP receiving mDKN01 (10 mg/kg) or control IgG antibody i.p. every other day. K, L Tumor progression was determined by BLI in mice inoculated intratibially with 4T1 cells (i.t.; 104 cells, BALB/c, n = 5/group) followed by administration of mDKN01 or control IgG antibody every other day. Results are shown as mean ± SEM. An unpaired t-test with a two-tailed P-value (A, C, E, I, K), and two-way ANOVA followed by Bonferroni multiple-comparison test (B, H, J) were used to determine significance. *P < 0.05, **P < 0.01, ***P < 0.001, ****P < 0.0001. Source data are provided as a Source Data file.
Fig. 2
Fig. 2. DKK1 is expressed in the tumor microenvironment.
A, C, E Normalized gene expression of DKK1 in healthy human breast tissues (n = 7) and triple-negative breast cancer (TNBC) (A, n = 18), HER2+ breast cancer (C, n = 4), ER+ breast cancer (E, n = 11) (GSE3744). B, D, F Representative images of multiplex immunohistochemistry (IHC) of TNBC (B, n = 20), HER2+ (D, n = 12), and ER+ (F, n = 8) human breast cancer subtypes stained for DKK1 (red), αSMA (green), PDGFRα (blue), and panCK (cyan). The green inset highlights the stromal area and the cyan inset highlights the tumor area. G Normalized gene expression of DKK1 in the stroma derived from normal breast tissue or invasive ductal carcinoma (IDC) (GSE8977). Results are shown as mean ± SEM. H Representative images of multiplex IHC of human ductal carcinoma in situ (DCIS) samples (n = 13) stained for DKK1 (red), αSMA (green), PDGFRα (blue), COL14a1 (white), and panCK (cyan) from patients who did not develop ipsilateral breast cancer (blue box) versus patients who developed ipsilateral breast cancer (red box). IK Representative images of DKK1 staining by IHC (brown) in orthotopic PyMT tumors (I, n = 5), spontaneous MMTV-PyMT breast tumors (J, n = 5), and orthotopic 4T1 tumors (K, n = 4). L, M Representative images of multiplex IHC of spontaneous MMTV-PyMT breast tumors (L, n = 5), and orthotopic 4T1 tumors (M, n = 4) stained for DKK1 (red), αSMA (green), COL1a1 (white), and EpCAM (MMTV-PyMT tumor cells, cyan) or GFP (4T1 tumor cells, cyan). An unpaired t-test with a two-tailed P-value (A, C, E, G) was used to determine significance. Source data are provided as a Source Data file.
Fig. 3
Fig. 3. Bone and CAF-derived DKK1 contribute to systemic and local increases in DKK1 levels during tumor progression.
A Tumor growth was determined by caliper measurements in 6–8 weeks old Sp7-Dkk1WT (control) and Sp7-Dkk1cKO female mice (n = 4 mice/group) inoculated with PyMT in the MFP. B, C qRT-PCR for Dkk1 expression in bone and primary tumor (TM). D DKK1 serum levels measured by ELISA. E Tumor growth was determined by caliper measurements in 10–12 weeks old control and αSMA-Dkk1cKO (n = 5 mice/group). F, G qRT-PCR for Dkk1 expression in bone and primary tumors (TM). H DKK1 serum levels measured by ELISA. I Multiplex immunohistochemistry (IHC) of orthotopic PyMT tumors in αSMA-Dkk1WT (top, n = 6) or αSMA-Dkk1cKO mice (bottom, n = 6) stained for DKK1 (red), αSMA (green), tdTomato (white) and hematoxylin (blue). J qRT-PCR for Dkk1 expression in sorted tdT+ CAFs from primary tumors in αSMA-Dkk1WT-tdT and αSMA-Dkk1cKO-tdT mice (n = 3/group). K Tumor growth was determined by caliper measurements in WT mice co-injected with 105 PyMT cells and 105 tdT+ CAFs isolated from αSMA-Dkk1WT-tdT or αSMA-Dkk1cKO-tdT (n = 8/group). Mice injected with tumor cells alone (n = 4) were used as control. L Representative immunofluorescence images of MDA-MB-231 cells stained for DKK1 (green) and DAPI (blue) (n = 3). M Tumor growth was determined by caliper measurements in Nude mice co-injected with 105 MDA-MB-231 cells and 105 tdT+ CAFs isolated from αSMA-Dkk1WT-tdT or αSMA-Dkk1cKO-tdT (n = 6/group). Mice injected with tumor cells alone (n = 6) were used as control. Results are shown as mean ± SEM. An unpaired t-test with a two-tailed P-value (BD, FH, J), two-way ANOVA followed by Bonferroni multiple-comparison test (A, E, K, M) were used to determine significance. *P < 0.05, **P < 0.01, ***P < 0.001, ****P < 0.0001. Source data are provided as a Source Data file.
Fig. 4
Fig. 4. DKK1 has immunomodulatory effects.
A Schematic representation of PyMT tumor cell isolation from IgG or mDKN01-treated mice (n = 3/group) and analysis of transcriptome via bulk RNA sequencing. B Venn diagram depicting uniquely and commonly expressed genes in PyMT cells isolated from orthotopic tumors injected into WT mice treated with IgG or mDKN01. C KEGG pathway enrichment analysis on differentially expressed genes (DEGs, p < 0.05, |fold change | >2). D GSEA analysis of hallmarks upregulated in PyMT tumor cells isolated from mDKN01-treated mice compared to IgG-treated mice. Normalized enrichment score (NES) and nominal P-value were calculated as previously described.
Fig. 5
Fig. 5. DKK1 supports tumor progression by targeting NK cells.
A Tumor-infiltrating CD45+ immune cells, NK cells, T cells, and myeloid subsets per gram of PyMT tumor mass from WT mice treated with IgG (n = 4) or mDKN01 (n = 5). BD Deconvoluted IHC images from orthotopic PyMT tumors stained for CD45 (red) and hematoxylin (gray) isolated from WT mice treated with IgG or mDKN01 (B, n = 5/group), αSMA-Dkk1WT and αSMA-Dkk1cKO mice (C, n = 5/group), and mice co-injected with tumor cells and tdT+ CAFs from tumors in αSMA-Dkk1WT-tdT or αSMA-Dkk1cKO-tdT mice (D, n = 8/group). E Tumor growth by caliper measurements in 6–8 weeks old NSG immune-compromised mice (n = 6 mice/group) inoculated with PyMT into the MFP. F, G PyMT orthotopic growth determined by caliper measurements in 6–8 weeks WT mice treated with IgG (n = 8) or mDKN01 (10 mg/kg, n = 8) every other day along with anti-CD4 and anti-CD8 (F, n = 4 and n = 9) or anti-NK1.1 (G, n = 4 and n = 8). H Tumor growth was determined by caliper measurements in Prf1/ mice inoculated with PyMT into the MFP and treated i.p. with mDKN01 (10 mg/kg) or control IgG antibody every other day (n = 4 mice/group). Results are shown as mean ± SEM. An unpaired t-test with a two-tailed P-value (A), two-way ANOVA followed by Bonferroni multiple-comparison test (E, H), ordinary one-way ANOVA followed by Dunnett’s multiple-comparison test (F, G) were used to determine significance. *P < 0.05, **P < 0.01, ***P < 0.001, ****P < 0.0001. Source data are provided as a Source Data file.
Fig. 6
Fig. 6. DKK1 suppresses NK cell cytotoxicity.
A Representative immunofluorescence images of mCherry+ PyMT cells (red) cultured with murine NK cells in the presence of PBS (n = 11) or rDKK1 (n = 9) for 3 h prior to fixation and staining for F-actin (green). Small, mCherry cells visualized by arrows or by image contrast in insets represent NK cells. Images in the insets are enlarged 1.5 times. B Schematic representation of NK cell isolation from the spleen of Poly I:C treated WT mice (n = 4) and incubation with PyMT target cells in the presence of PBS or rDKK1. C Analysis of percent specific killing measured by 7-AAD+ PyMT target cells after 4 h incubation with NK cells. (n of wells per condition = 3). DG Schematic representation of CAF isolation from orthotopic PyMT tumors in αSMA-DKK1WT-tdT mice (D, n = 5), osteoblast precursor (pre-OB) isolation from the bone marrow of tumor-bearing WT mice (F, n = 3) and isolation of NK cells from the spleen of Poly I:C injected mice (n = 4). NK cells and increasing numbers of CAFs/pre-OBs were incubated with PyMT target cells in the presence of mDKN01 or IgG (50 mg/ml) and percent specific killing measured by 7-AAD+ PyMT target cells after 4 h incubation with NK cells (2:1 NK cell to PyMT ratio) (E, G n of wells per condition = 3). Results are shown as mean ± SEM. Experiments in (C, E, G) were performed in triplicates. Two-way ANOVA followed by Bonferroni multiple-comparison test was used to determine significance (C, E, G). **P < 0.01, ***P < 0.001, ****P < 0.0001. Source data are provided as a Source Data file.
Fig. 7
Fig. 7. DKK1 downregulates PI3K/AKT/mTOR and MAPK/ERK signaling pathways in NK cells.
A Venn diagram indicating numbers of uniquely and commonly expressed genes in NK cells isolated spleen of Poly I:C treated WT mice (n = 3) and stimulated with rDKK1 (200 ng/ml) or PBS as a control (n = 3/group). B KEGG pathway enrichment analysis showing differentially expressed genes (DEGs, p < 0.05, |fold change | >2). C GSEA analysis showing hallmarks downregulated in rDKK1 stimulated NK cells. Normalized enrichment score (NES) and nominal P-value were calculated as previously described. D Heatmap of genes related to NK cell cytotoxicity in PBS or rDKK1 stimulated NK cells. E Fold changes from baseline of mean fluorescence intensity (MFI) measurements of phosphorylated AKT, S6, ERK1/2, and STAT5 in NK1.1+ NK cells from the spleens of Rag1/ mice (n = 4) following stimulation with rDKK1 (200 ng/ml) for indicated times. F, G Fold changes in the percentage of NK cells expressing CD107a (F) or IFNγ (G) following ex vivo stimulation with anti-NK1.1 antibody (F) or a cytokine cocktail of IL-12 + IL-15 compared to unstimulated cells were evaluated in the PyMT tumor mass and bone marrow of αSMA-Dkk1WT (n = 4) or αSMA-Dkk1cKO mice (n = 6). Results are shown as mean ± SEM. Ordinary one-way ANOVA followed by Dunnett’s multiple-comparison test (E), and an unpaired t-test with a two-tailed P-value (F, G) were used to determine significance. *P < 0.05, **P < 0.01, ***P < 0.001, ****P < 0.0001. Source data are provided as a Source Data file.
Fig. 8
Fig. 8. DKK1 levels correlate with reduced therapeutic responses and cytotoxic NK cells.
Schematic representation of NK cell isolation from healthy donor human PBMCs and incubation with target cells in the presence of PBS or rhDKK1 for 4 h. BD Analysis of percent specific killing measured by 7-AAD+ MDA-MB-231 (B, n = 7 NK donors), T47D (C, n = 3 NK donors), and K562 (D, n = 3 NK donors) target tumor cells after 4 h incubation with human NK cells in the presence of rhDKK1 or PBS as a control. E FACS analysis of NK cell activating receptors on human NK cells from different donors (n = 11) stimulated with rhDKK1 for 24 h or PBS. F Schematic representation of blood sample collection of advanced breast cancer patients at the time of diagnosis of bone metastases and at 15–18 months follow-up visit receiving standard-of-care and antiresorptive treatments. G, H DKK1 plasma levels, and percent of NK cell subsets in patients with regressive/stable (blue, n = 7) versus progressive bone metastases (red, n = 8) from initial diagnosis (abbreviated as I) and follow-up visits (abbreviated as F). Results are shown as mean ± SEM (BD). Two-way ANOVA followed by Bonferroni multiple-comparison test (BD), and a paired t-test with a two-tailed P-value (E, G, H) were used to determine significance. *P < 0.05, **P < 0.01, ****P < 0.0001. Source data are provided as a Source Data file.

Update of

References

    1. Siegel, R. L., Miller, K. D. & Jemal, A. Cancer statistics, 2020. CA Cancer J. Clin.70, 7–30 (2020). - PubMed
    1. Redig, A. J. & McAllister, S. S. Breast cancer as a systemic disease: a view of metastasis. J. Intern. Med.274, 113–126 (2013). - PMC - PubMed
    1. Cortes, J. et al. Pembrolizumab plus chemotherapy in advanced triple-negative breast cancer. N. Engl. J. Med.387, 217–226 (2022). - PubMed
    1. Schmid, P. et al. Event-free survival with pembrolizumab in early triple-negative breast cancer. N. Engl. J. Med.386, 556–567 (2022). - PubMed
    1. Debien, V. et al. Immunotherapy in breast cancer: an overview of current strategies and perspectives. NPJ Breast Cancer9, 7 (2023). - PMC - PubMed

MeSH terms

Substances

LinkOut - more resources