. 2025 Jan 30;16(1):1175.
doi: 10.1038/s41467-025-56484-8.

Oligodendrocyte precursor cells facilitate neuronal lysosome release

Affiliations

Oligodendrocyte precursor cells facilitate neuronal lysosome release

Li-Pao Fang et al. Nat Commun. .

Abstract

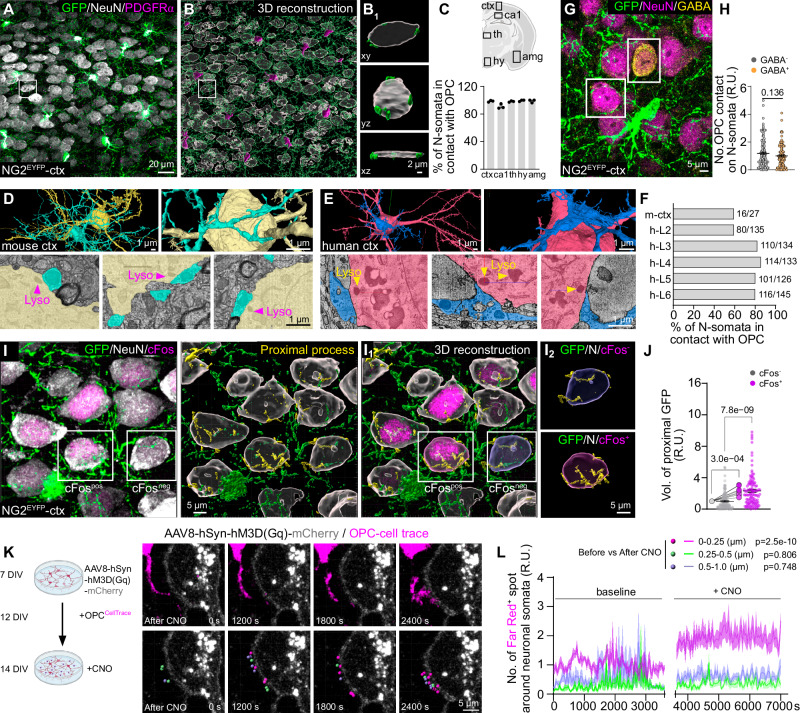
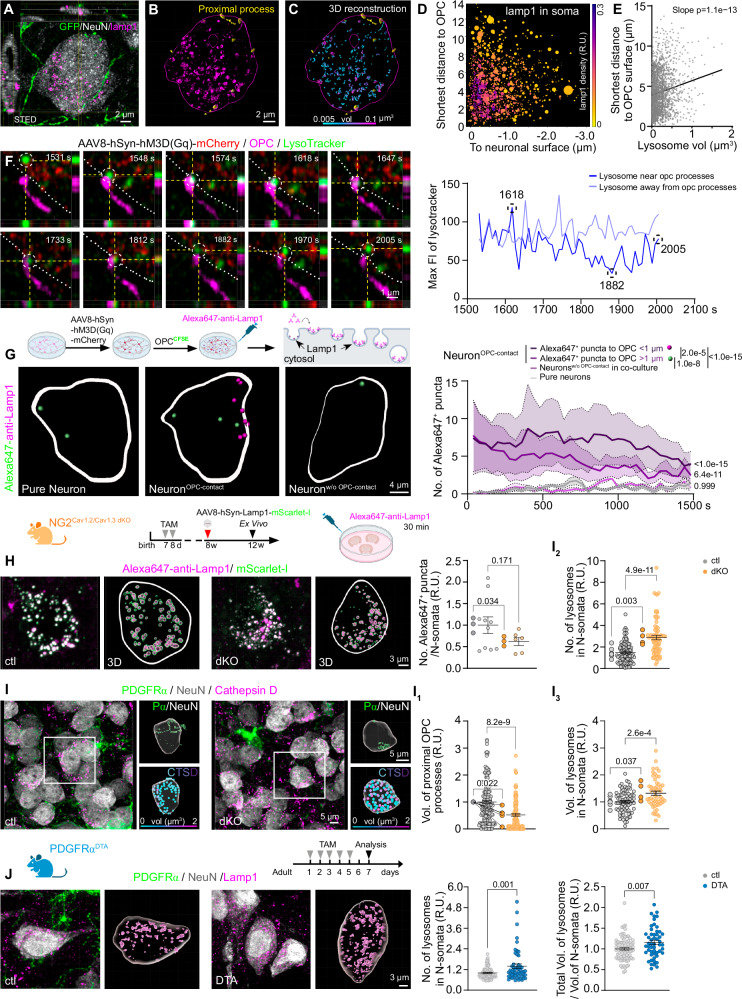
Oligodendrocyte precursor cells (OPCs) shape brain function through many non-canonical regulatory mechanisms beyond myelination. Here we show that OPCs form contacts with their processes on neuronal somata in a neuronal activity-dependent manner. These contacts facilitate exocytosis of neuronal lysosomes. A reduction in the number or branching of OPCs reduces these contacts, which is associated with lysosome accumulation and altered metabolism in neurons and more senescent neurons with age. A similar reduction in OPC branching and neuronal lysosome accumulation is seen in an early-stage mouse model of Alzheimer's disease. Our findings have implications for the prevention of age-related pathologies and the treatment of neurodegenerative diseases.


Conflict of interest statement

Competing interests: The authors declare no competing interests.

Figures

Fig. 1
Fig. 1. OPC processes contact neuronal somata with a preference for active neurons.
A, B Immunostaining and 3D reconstruction of OPCs and neurons with GFP, PDGFRα and NeuN antibodies in coronal brain slices of NG2EYFP mice. B1 Exemplary images of process-somata contact (PSC) between OPCs and neurons from the boxed area of B, shown in three directions. C Percentage of neurons with PSCs in the cortex (ctx), hippocampal CA1 region (ca1), thalamus (th), hypothalamus (hy) and amygdala (amg) (N = 3 mice). DF Ultrastructural images (D, E) and quantification (F) of PSCs in mouse (D) and human cortex (E). G, H Immunostaining and quantification of OPC (GFP+) contacts on GABAergic (GABA+) and non-GABAergic (GABA-) neurons in NG2EYFP mice (127 GABA- neurons and 109 GABA+ neurons from 5 mice, normalized to GABA- neurons, two-sided unpaired t test). I Immunostaining of OPCs and neurons with GFP and NeuN in the cortex of NG2EYFP mice. Neuronal activity was indicated with cFos (magenta) immunoreactivity and contacting processes were indicated in yellow. I1 3D-reconstruction of neuronal somata and OPCs. OPC processes contacting neuronal somata were indicated in yellow. I2 Exemplary cFos+ and cFos- neurons with OPC contacts. J Quantification of relative volume of OPC processes (GFP+) contacting cFos+ and cFos- neurons (normalized to cFos- cells). (117 cFos- cells and 118 cFos+ cells from 8 mice, two-sided unpaired t-test for cells (small dots) and two-sided paired t-test for mice (large dots)). K Live-imaging of neuron (hM3D(Gq)-mCherry+)-OPC (CellTrace+) interaction before and after CNO application. L The relative number of processes contacting (0–0.25 µm), near (0.25–0.5 µm) and far from (0.5–1.0 µm) the neurons were quantified and compared before and after CNO application (5 cells/5 independent experiments, one-way ANOVA, Multiple comparison). R.U.=relative units, normalized to the controls (5 cells/5 independent experiments, in each experiment OPCs are prepared from 4 pups). Data are shown as mean ± SEM in C, H, J, and L. Source data are provided as a Source Data file. Created in BioRender. Fang, L. (2025) https://BioRender.com/n88b804.
Fig. 2
Fig. 2. OPC contact facilitates neuronal lysosome release at the contact site.
AC Immunostaining and 3D-reconstruction of neurons, OPCs and lysosomes in NG2EYFP mouse cortex using NeuN, GFP and Lamp1 antibodies. B OPC processes contacting neuronal somata were indicated in yellow. C Neuronal lysosomes shown in colors based on their volume. D Display of lysosome volume (indicated by circle size) and their proximity to OPC and neuronal surfaces (5925 lysosomes from 17 cells/3 mice). The color indicates the frequency of lysosomal appearance at corresponding location. E Correlation of lysosome volume and proximity to OPC surface (2077 lysosomes from 17 cells/3 mice). F Live-imaging of a lysosome (dotted circle) trafficking in neuron-OPC co-culture and analysis of maximum fluorescence intensity (MAX FI) of lysosomes over the period. Dotted line indicates neuronal membrane. G Live-imaging and quantification of lysosome exocytosis in neurons from pure neuronal culture and neurons with (neuronOPC-contact) or without OPC contact (neuronsw/o-OPC-contact) from co-culture. In neuronsOPC-contact, the Alexa647+ puncta were classified into proximal (<1 µm, magenta) and distal (>1 µm, green) based on their distance to OPC contact site (Pure neuron=9 cells/4 independent experiments; neuronsOPC-contact = 9 cells/4 independent experiments, neuronsw/o-OPC-contact = 3 cells/3 independent experiments; 4 pups/experiment, two-way ANOVA, multiple comparisons). H Lysosome exocytosis in acute brain slices was imaged and the number of Alexa647+ puncta in each neuron was quantified (ctl = 10 cells/3 mice; dKO=6 cells/3 mice). I Immunostaining and 3D-reconstruction of OPCs (PDGFRα+), neurons (NeuN+) and lysosomes (Cathepsin D, CTSD+). I1 Quantification of relative volume of OPC processes contacting neuronal somata (ctl = 190 cells/5 mice, dKO = 116 cells/5 mice). I2, I3 Analysis of the relative number and volume of neuronal lysosomes. (ctl = 112 cells/7 mice, dKO = 74 cells/4 mice). J Immunolabeling and 3D reconstruction of neurons, OPCs and lysosomes with NeuN, PDGFRα and Lamp1 antibodies. The relative number and volume of neuronal lysosomes were quantified. (ctl = 80 cells/5 mice, DTA = 52 cells/4 mice). In (HJ), small dots represent cells while big dots represent mice, two-sided unpaired t-tests were used. R.U. = relative units, normalized to the controls. Data are shown as mean ± SEM in (GJ). Source data are provided as a Source Data file. Created in BioRender. Fang, L. (2025) https://BioRender.com/a00p319 and https://BioRender.com/v85j019.
Fig. 3
Fig. 3. Reduced OPC-neuron contacts induce an accumulation of lysosomes and functional impairment in neurons.
A Immunostaining and quantification of lipid droplets in cortical neurons of control (ctl) and double knockout (dKO) mice with NeuN and BODIPY antibodies, respectively (4 mice per group). B Immunostaining and quantification of cFos+ cells in the whole brain of ctl and dKO mice (4 mice per group). C, D Dot plot of enriched gene ontology terms for biological processes (BP), cellular components (CC), molecular functions (MF), and KEGG pathways in genes from OPCs and neurons of dKO mice. E List of differentially expressed genes in OPCs and neurons of the dKO mice (M, bulkRNA-seq) and AD patients in early pathology (H, scRNA-seq). F, G Immunostaining and quantification of senescent neurons with NeuN and p16INK4A (P16) at 12 months of age (ctl = 3 mice, dKO = 4 mice). H 3D reconstruction of OPCs immunolabelled with PDGFRα (Pα) at 6 months of age. I, J Morphological analysis of OPCs for the number of process intersections (I) and total process length (J) (ctl = 51 cells/3 mice, Tg2576 = 52 cells/3 mice). K Immunostaining and 3D reconstruction of OPCs (Pα), neurons (NeuN) and lysosomes (Cathepsin D, CSTD). L Quantification of the relative volume of OPC processes in contact with neuronal soma (ctl = 91 cells/3 mice, Tg2576 = 117 cells/3 mice) and the number of neuronal lysosomes (ctl=87 neurons/5 mice, Tg2576 = 115 neurons/5 mice). M, N Quantification of the relative mean distance between neuronal lysosomes and OPC surface (ctl = 91 cells/3 mice, Tg2576 = 117 cells/3 mice). M The size of the lysosomes is represented by the size of the filled circles, while the color indicates the frequency of each size in the total analysis. R.U. = relative units, normalized to the controls. Data are shown as mean ± SEM in (A, G, I, J, L, and N). Two-sided unpaired t test was used in (A, B, G, I, J, L, and N). Source data are provided as a Source Data file. Created in BioRender. Fang, L. (2025) https://BioRender.com/f32o880.

References

    1. Hughes, E. G., Kang, S. H., Fukaya, M. & Bergles, D. E. Oligodendrocyte progenitors balance growth with self-repulsion to achieve homeostasis in the adult brain. Nat. Neurosci.16, 668–676 (2013). - PMC - PubMed
    1. Khawaja, R. R. et al. GluA2 overexpression in oligodendrocyte progenitors promotes postinjury oligodendrocyte regeneration. Cell Rep.35, 109147 (2021). - PMC - PubMed
    1. Fang, L. P. et al. Impaired bidirectional communication between interneurons and oligodendrocyte precursor cells affects social cognitive behavior. Nat. Commun.13, 1394 (2022). - PMC - PubMed
    1. Bergles, D. E., Roberts, J. D., Somogyi, P. & Jahr, C. E. Glutamatergic synapses on oligodendrocyte precursor cells in the hippocampus. Nature405, 187–191 (2000). - PubMed
    1. Lin, S. C. & Bergles, D. E. Synaptic signaling between GABAergic interneurons and oligodendrocyte precursor cells in the hippocampus. Nat. Neurosci.7, 24–32 (2004). - PubMed

LinkOut - more resources