

Modelling the seasonal dynamics of Aedes albopictus populations using a spatio-temporal stacked machine learning model
- PMID: 39885207
- PMCID: PMC11782657
- DOI: 10.1038/s41598-025-87554-y
Modelling the seasonal dynamics of Aedes albopictus populations using a spatio-temporal stacked machine learning model
Abstract
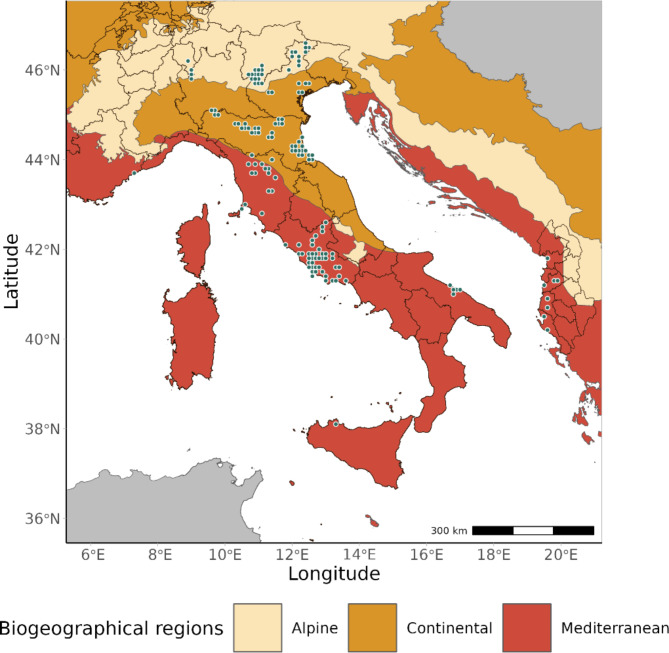
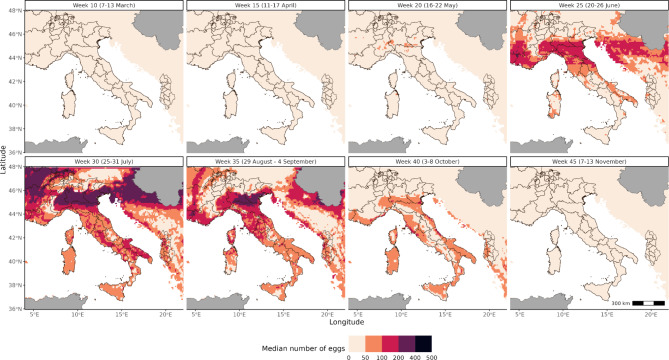
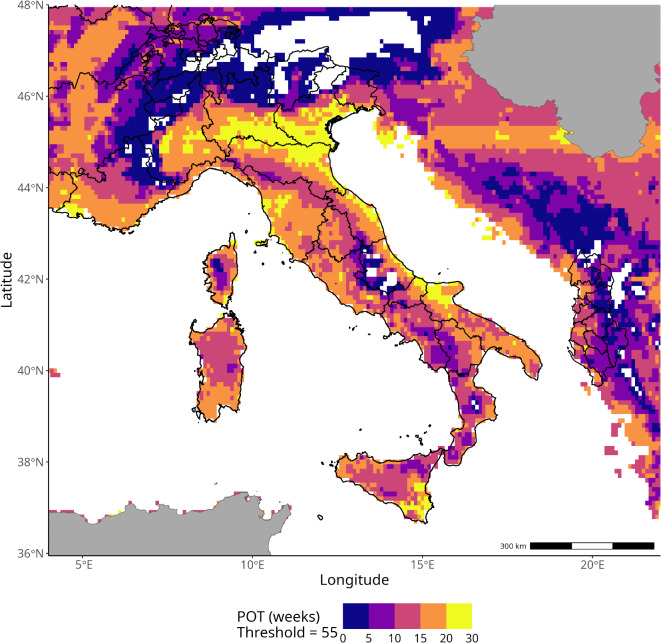
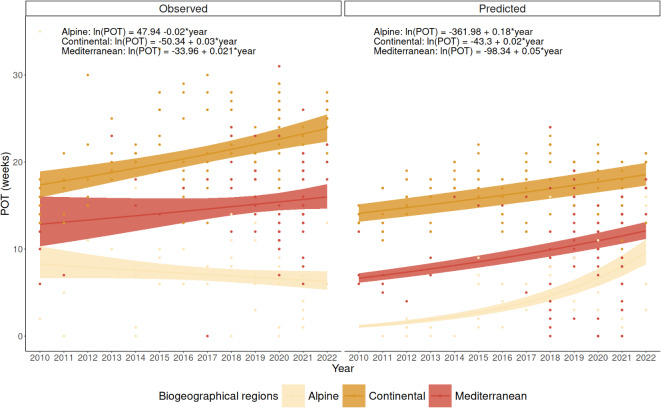
Various modelling techniques are available to understand the temporal and spatial variations of the phenology of species. Scientists often rely on correlative models, which establish a statistical relationship between a response variable (such as species abundance or presence-absence) and a set of predominantly abiotic covariates. The choice of the modeling approach, i.e., the algorithm, is itself a significant source of variability, as different algorithms applied to the same dataset can yield disparate outcomes. This inter-model variability has led to the adoption of ensemble modelling techniques, among which stacked generalisation, which has recently demonstrated its capacity to produce robust results. Stacked ensemble modelling incorporates predictions from multiple base learners or models as inputs for a meta-learner. The meta-learner, in turn, assimilates these predictions and generates a final prediction by combining the information from all the base learners. In our study, we utilized a recently published dataset documenting egg abundance observations of Aedes albopictus collected using ovitraps. and a set of environmental predictors to forecast the weekly median number of mosquito eggs using a stacked machine learning model. This approach enabled us to (i) unearth the seasonal egg-laying dynamics of Ae. albopictus for 12 years; (ii) generate spatio-temporal explicit forecasts of mosquito egg abundance in regions not covered by conventional monitoring initiatives. Our work establishes a robust methodological foundation for forecasting the spatio-temporal abundance of Ae. albopictus, offering a flexible framework that can be tailored to meet specific public health needs related to this species.
Keywords: Arthropod; Forecast; Invasive species; Mosquito; Population dynamics; Time-series..
© 2025. The Author(s).
Conflict of interest statement
Declarations. Competing interests: The authors declare no competing interests.
Figures


References
-
- Fand, B. B., Choudhary, J. S., Kumar, M. & Bal, S. K. Phenology modelling and GIS applications in pest management: A tool for studying and understanding insect-pest dynamics in the context of global climate change. Approaches Plant Stress Manag. 107–124 (2014).
-
- Ettinger, A. K., Chamberlain, C. J. & Wolkovich, E. M. The increasing relevance of phenology to conservation. Nat. Clim. Change12(4), 305–307 (2022). - DOI
Publication types
MeSH terms
Supplementary concepts
Grants and funding
LinkOut - more resources
Full Text Sources
