. 2025 Feb;6(2):307-322.
doi: 10.1038/s43018-024-00891-1. Epub 2025 Jan 30.

Decoding pan-cancer treatment outcomes using multimodal real-world data and explainable artificial intelligence

Affiliations

Decoding pan-cancer treatment outcomes using multimodal real-world data and explainable artificial intelligence

Julius Keyl et al. Nat Cancer. 2025 Feb.

Abstract

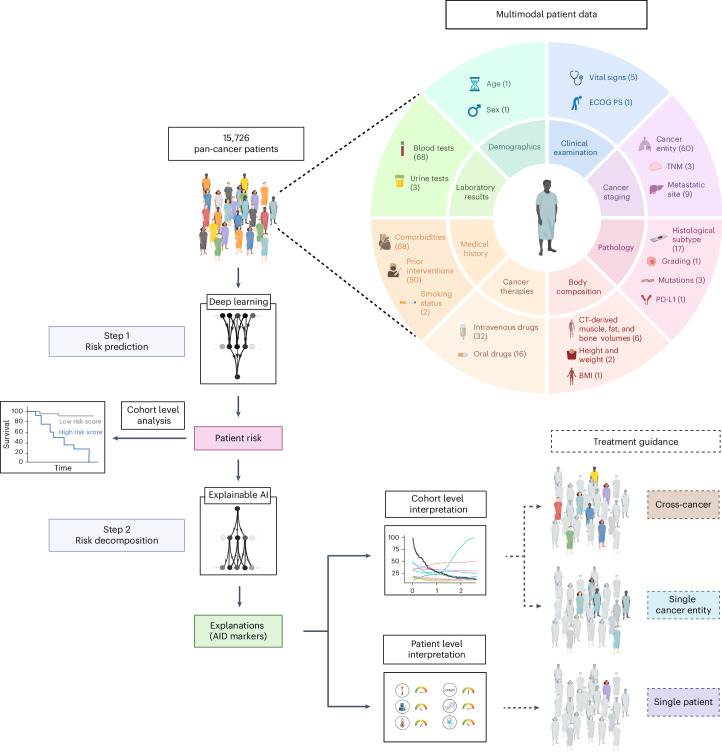
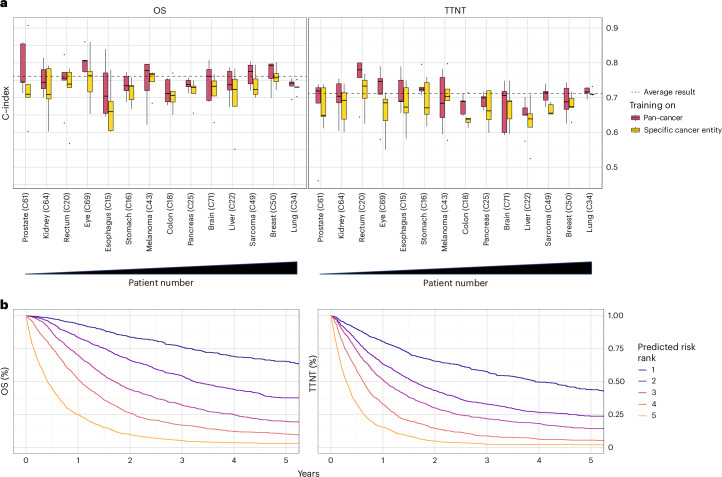
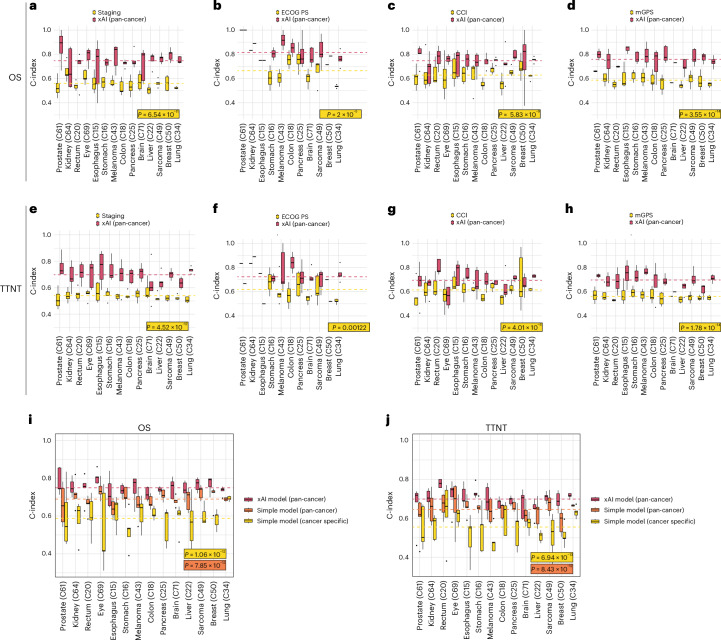
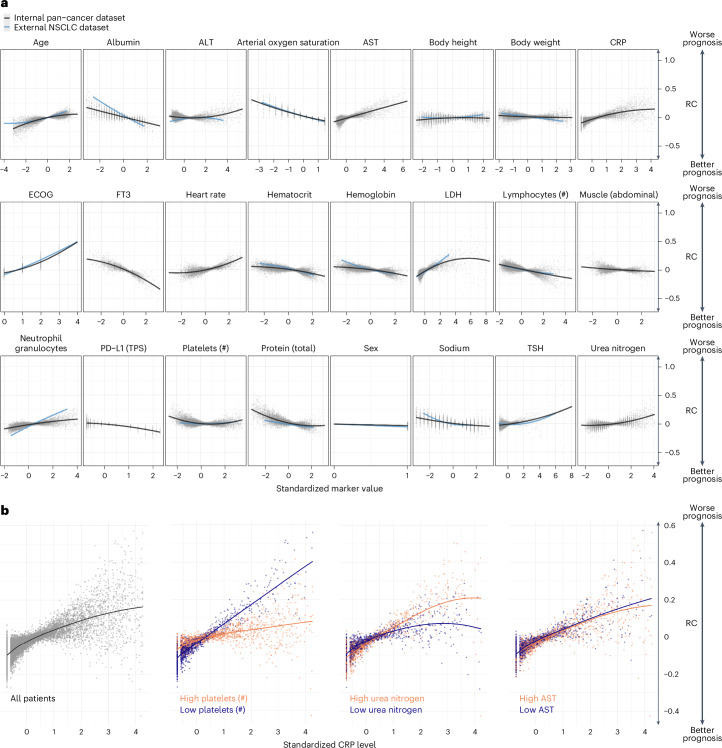
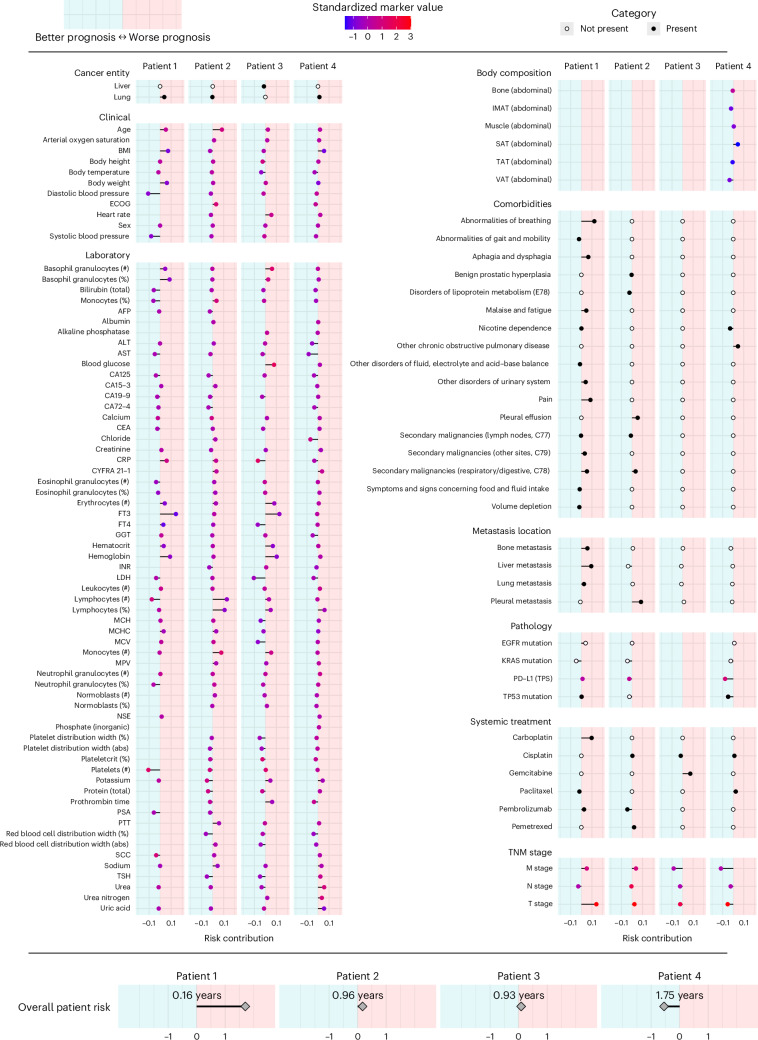
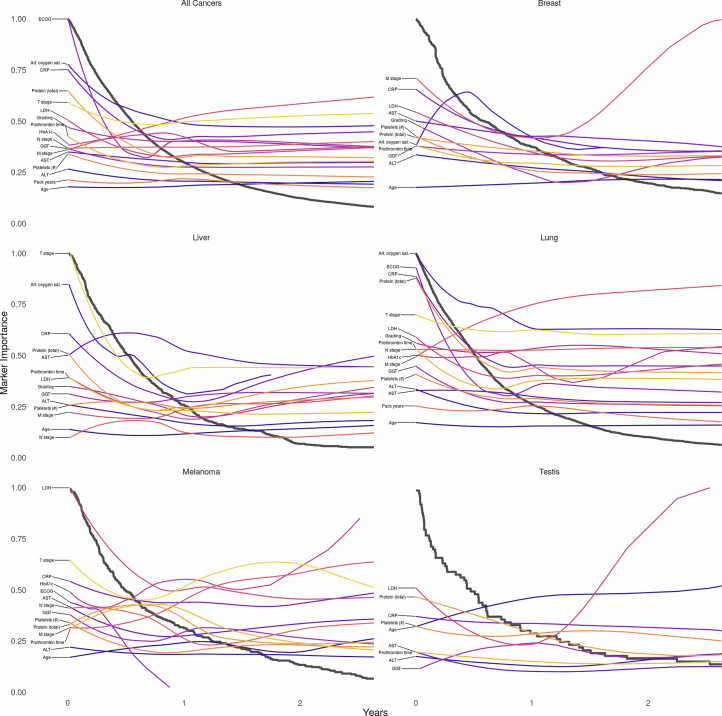
Despite advances in precision oncology, clinical decision-making still relies on limited variables and expert knowledge. To address this limitation, we combined multimodal real-world data and explainable artificial intelligence (xAI) to introduce AI-derived (AID) markers for clinical decision support. We used xAI to decode the outcome of 15,726 patients across 38 solid cancer entities based on 350 markers, including clinical records, image-derived body compositions, and mutational tumor profiles. xAI determined the prognostic contribution of each clinical marker at the patient level and identified 114 key markers that accounted for 90% of the neural network's decision process. Moreover, xAI enabled us to uncover 1,373 prognostic interactions between markers. Our approach was validated in an independent cohort of 3,288 patients with lung cancer from a US nationwide electronic health record-derived database. These results show the potential of xAI to transform the assessment of clinical variables and enable personalized, data-driven cancer care.


Conflict of interest statement

Competing interests: V.G. receives honoraria from Bristol Myers Squibb, Pfizer, Ipsen, Eisai, Merck Sharp & Dohme (MSD) Oncology, Merck HealthCare, EUSAPharm, Apogepha and Ono Pharmaceutical; has an advisory role at BMS, Pfizer, MSD Oncology, Merck HealthCare, Ipsen, Eisai, Debiopharm, PCI Biotech, Cureteq and Oncorena; and received travel funding from Pfizer, Ipsen and Merck HealthCare. B.H. has an advisory role at ABX, AAA/Novartis, Astellas, AstraZeneca, Bayer, BMS, Janssen R&D, Lightpoint Medical and Pfizer; receives research funding from Astellas, BMS, AAA/Novartis, German Research Foundation, Janssen R&D and Pfizer; and receives travel funding from Astellas, AstraZeneca, Bayer and Janssen. D.S. receives personal fees for advisory boards of BMS, Immunocore, MSD, Neracare, Novartis, Pfizer, Philogen, Pierre Fabre, Sanofi and Regeneron; personal fees as an invited speaker from BMS, Merck Serono, MSD, Novartis, Roche and Sanofi; personal fees (financial interest) for steering committee membership from BMS and MSD; personal support (no financial interest) for steering committee membership from Novartis; institutional support as a coordinating principal investigator (no financial interest) from BMS, MSD, Novartis and Pierre Fabre; institutional support as a local principal investigator (no financial interest) from Philogen and Sanofi; institutional research grant support (financial interest) from BMS and MSD; and is an EORTC-MG Member of the Board of Directors (no financial interest). J.T.S. receives honoraria as consultant or for continuing medical education presentations from AstraZeneca, Bayer, Boehringer Ingelheim, Bristol-Myers Squibb, Immunocore, MSD Sharp Dohme, Novartis, Roche/Genentech and Servier; his institution receives research funding from Abalos Therapeutics, Boehringer Ingelheim, Bristol-Myers Squibb, Celgene, Eisbach Bio and Roche/Genentech; and he holds ownership and serves on the Board of Directors of Pharma15, all outside the submitted work. M.T. receives speaker fees and personal support from AstraZeneca, Daiichi Sankyo, Novartis, Bayer, Asklepios and Edwards LifeSciences. M.W. receives honoraria and has an advisory role: Amgen, AstraZeneca, Daiichi Sankyo, GlaxoSmithKline, Janssen, Novartis, Pfizer, Roche, Takeda. Research funding: Bristol-Myers Squibb, Takeda. M.S. is a consultant (compensated) for Amgen, AstraZeneca, Blueprint Medicines, Boehringer Ingelheim, Bristol-Myers Squibb, GlaxoSmithKline, Janssen, Merck Serono, Novartis, Roche, Sanofi and Takeda; receives honoraria for CME presentations from Amgen, Boehringer Ingelheim, Bristol Myers Squibb, Janssen, MSD, Novartis, Roche and Sanofi; and receives research funding (institutional) from AstraZeneca and Bristol-Myers Squibb. K.-R.M., F.K. and G.M. hold patents related to this work (9558550; 20180018553) and are co-founders of the computational pathology start-up Aignostics, Berlin. The remaining authors declare no competing interests related to this study.

Figures

Fig. 1
Fig. 1. Overview of the data composition and explainable AI (xAI)-based workflow for decoding treatment outcomes.
Following the collection of multimodal pan-cancer data, each patient’s risk score is predicted by deep learning and enables patient stratification. xAI then decomposes the patient risk into the individual contributions of each marker. This enables treatment guidance at the patient and cohort level. The numbers in parentheses indicate the number of variables for each data type.
Fig. 2
Fig. 2. Prediction of prognosis following training on pan-cancer RWD.
a, Concordance index for predicting OS and TTNT in five-fold cross-validation. The dashed line indicates the prediction result over all patients averaged across folds. Box plots show prediction results for individual cancer entities with at least 20 patients in the test set (n = 6,070 patients overall; prostate: n = 131; kidney: n = 147; eye: n = 187; esophagus: n = 198; rectum: n = 199; stomach: n = 300; pancreas: n = 304; brain: n = 312; colon: n = 319; melanoma: n = 324; liver: n = 373; sarcoma: n = 538; breast: n = 619; lung: n = 2,119) of each fold after training the neural network on all cancer entities (red) or the specific cancer entity (yellow). Cancer entities are ordered from left to right by ascending patient numbers in the overall dataset. Median is indicated by center line, bounds of boxes indicate interquartile range, and whiskers extend to a maximum distance of 1.5 ⋅ IQR from the hinge. Data beyond the end of whiskers are plotted individually. b, Kaplan-Meier plots for OS and TTNT in the pan-cancer dataset for patients of the combined test sets (n = 7,861) patients. Patients were stratified into five risk groups according to the risk predicted by the (pan-cancer trained) neural network. Source data
Fig. 3
Fig. 3. Benchmarking xAI against common clinical prognostic approaches.
ah, Filtered for patients for whom clinical markers were present. Lines indicate the average of all C-indices calculated for each fold and cancer type. a,e, UICC Staging (n = 7,572 patients, P = 6.54 × 10⁻¹¹ and 4.52 × 10⁻¹²). b,f, Eastern Cooperative Oncology Group performance status (ECOG PS) (n = 2,035 patients, P = 2 × 10⁻⁵ and 0.00122). c,g, Charlson Comorbidity Index (CCI; n = 7,965 patients, P = 5.83 × 10⁻⁹ and 4.01 × 10⁻⁶). d,h, Modified Glasgow prognostic score (mGPS; n = 6,042 patients, P = 3.55 × 10⁻¹⁴ and 1.78 × 10⁻¹⁴). i,j, Comparison between the pan-cancer xAI model and a parsimonious Cox model trained on all patients or on patients with the test set tumor type for OS (i, n = 6,070 patients, P = 1.06 × 10⁻¹² and 7.85 × 10⁻¹²) and TTNT (j, n = 6,070 patients, P = 6.94 × 10⁻¹³ and 8.43 × 10⁻¹²). Median is indicated by center line, bounds of boxes indicate interquartile range and whiskers extend to a maximum distance of 1.5 ⋅ IQR from the hinge. Data beyond the end of whiskers are plotted individually. P values are derived from Wilcoxon ranked test (two sided). Source data
Fig. 4
Fig. 4. Contribution of clinical markers to the prediction of OS.
a, Marker RC on the OS prediction. Each point represents one marker value for one patient versus the LRP-assigned RC (y axis) to the patient’s prognosis. Marker values are standardized. b, RC of CRP depended on the value of other markers. The left plot shows the standardized CRP level and LRP-assigned RC for all patients. The right three plots depict the patients for whom the three selected markers: platelet count, urea nitrogen and AST, were in the highest or lowest 10% quantile. Source data
Fig. 5
Fig. 5. Clinician’s guide showing the contribution of each marker to overall risk at the patient level.
Representative results of four patients are presented. The x axis indicates the marker’s RC toward higher (right/positive) or lower (left/negative) risk. Colors indicate the presence (black) or absence (white) of cancer entities, comorbidities, metastasis locations and systemic treatment. For markers with ordinal or continuous scales, the point color indicates the marker value for the respective patient. For continuous markers, marker values are standardized. The predicted overall patient risk is displayed at the bottom. To facilitate interpretation, the median absolute survival of 100 patients with a similar predicted risk is given. Body composition markers: abdominal volumes of visceral adipose tissue (VAT), total adipose tissue (TAT), subcutaneous adipose tissue (SAT), intermuscular adipose tissue (IMAT), muscle, bone. Source data
Fig. 6
Fig. 6. Relationship between mean marker importance (MI) of selected markers and cancer entities.
The x axis shows the MI on a logarithmic scale. The three cancer entities with the highest marker MI are annotated for each marker. Body composition markers: Abdominal volumes of VAT, TAT, SAT, intermuscular adipose tissue (IMAT), muscle, bone. Cancer entities are shown only if the respective marker has been measured in at least 20 patients. Source data
Fig. 7
Fig. 7. Explainable Kaplan-Meier plots depicting the importance of diagnostic markers during disease progression.
Black lines represent Kaplan-Meier plots, whereas the colored lines visualize the change in marker importance (MI) for patients with different survival times. MI lines are scaled between zero and one. Only deceased patients were included in this analysis (pan-cancer: n = 8,377, breast: n = 487, liver: n = 451, lung: n = 2,753, melanoma: n = 206, testis: n = 50). Selected markers were measured in at least 40 patients and within a 2-year window. Art. oxygen sat., arterial oxygen saturation. Source data
Extended Data Fig. 1
Extended Data Fig. 1. Patient inclusion.
Flowchart showing the process of patient inclusion.
Extended Data Fig. 2
Extended Data Fig. 2. Calibration results.
Calibration plots showing the relationship between average predicted survival probability (x axis) and observed survival probability (via Kaplan-Meier fitter) on the test set. a: Internal dataset (OS), b: Internal dataset (TTNT), c: External dataset (OS). ECE: Expected calibration error, ICI: Integrated calibration index. Source data
Extended Data Fig. 3
Extended Data Fig. 3. Replicability of the xAI approach and comparison to linear methods.
A: Replicability of the xAI approach on the external dataset. Axes indicate the (linearized) relationship between marker values and their xAI-assigned RCs for the Internal (x axis) and external (y axis) datatset. B,C: Validation of xAI results with Cox regression models. The x axis shows the linearized relationships between marker values and RC according to xAI. The y axis shows the hazards of each marker according to a univariate cox regression model on the same dataset (B: Internal data, C: External data). D: Validation of xAI results with Cox regression models (all markers, Pearson’s r = 0.85). E: Comparison of higher order interactions identified by xAI between internal (x axis) and external (y axis) dataset. Given the linearized relationship between a marker Y and the RC of Y, the label X- > Y defines how this relationship changes between patient groups with high and low X. F, G: Complex interactions found by xAI can be validated with mixed-effects Cox proportional hazards models. The effects captured by xAI (x axis) correspond strongly to the effects estimated by mixed-effects Cox proportional hazards models (F: Internal data, G: External data). Source data
Extended Data Fig. 4
Extended Data Fig. 4. Prognostic value of selected markers.
A: Marker risk contribution (RC) on the TTNT prediction. Each point represents one marker value for one patient versus the LRP-assigned RC (y-axis) to the patient’s prognosis. Marker values are standardized. B: The risk contribution of CRP depended on the value of other markers. The standardized CRP level and LRP-assigned RC are shown for all patients in the left plot. The right three plots depict the patients for whom the three selected markers platelet count, urea nitrogen and AST were in the highest or lowest 10% quantile. C: Comparison of established prognostic scores with the LRP-assigned RC for OS (n = 7,196 patients). The x-axis depicts the value of the different scores. The y-axis indicates the RC. Comparison is shown for each marker and cancer type. Cancer entities are shown only if the respective marker has been measured in at least 20 patients. Adjusted P values are shown in brackets (two-sided, Pearson’s correlation, Holms correction). Adjusted P values for ECOG PS were 4.78e-04, 6.60e-19, 5.56e-11, 9.42e-07, 3.80e-11, 1.25e-18, 5.89e-242, 5.90e-21, 4.84e-10, 7.75e-04, 2.86e-31, 1.37e-12, and 2.97e-13. For Grading, adjusted P values were 1, 1, 1, 0.58, 1, 0.000178, 1, 0.00256, 1, 1, 1, 1, 1. For M stage, all P values were <2e-16. For N stage, all P values were <2e-16 except for Skin (P = 7.7e-13). For T stage, P values were 1, 1, 1, 1, 1, 0.177, 7.18e-07, 0.549, 0.279, 1, 0.00123, 1, 1. Source data
Extended Data Fig. 5
Extended Data Fig. 5. Cumulative relevance for neural network decision-making.
A: OS, B: TTNT. All markers are ranked according to the decreasing marker importance (MI) assigned by LRP across all patients (x axis). MI is corrected for missing values. Y axis shows the cumulative MI. 90 % of all MI is assigned to 114 (TTNT: 115) key prognostic markers. Markers measured in at least 20% of the cancer entities in at least 10% of the patients are shown in black. Source data
Extended Data Fig. 6
Extended Data Fig. 6. Marker importance.
Markers are ordered from top to bottom according to decreasing importance across all patients. A, B: Risk contribution (RC) of markers in individual patients is shown on the x axis. RC indicates the contribution to a better (negative) or worse (positive) prognosis. Point color indicates high (red) or low (blue) marker value. (A: OS, B: TTNT). Cancer entities are shown only if the respective marker has been measured in at least 20 patients. C, D: ICD (black) and OPS codes (blue) with the highest assigned RC. C: OS (n = 9,713), D: TTNT (n = 9,604). Median is indicated by center line, bounds of boxes indicate interquartile range, and whiskers extend to a maximum distance of 1.5 ⋅ IQR from the hinge. Data beyond the end of whiskers are plotted individually. Source data
Extended Data Fig. 7
Extended Data Fig. 7. Relationship between marker importance and cancer entities for TTNT.
The x axis shows the MI on a logarithmic scale. For each marker, the three cancer entities with the highest marker MI are annotated. Body composition markers: Abdominal volumes of visceral adipose tissue (VAT), total adipose tissue (TAT), subcutaneous adipose tissue (SAT), intermuscular adipose tissue (IMAT), muscle, bone. Source data
Extended Data Fig. 8
Extended Data Fig. 8. xKM curves for tumor-specific markers (OS).
xKM curves show the progress of marker contribution for the prediction of overall survival (OS) for tumor-specific markers along disease progression. Black lines represent Kaplan-Meier plots, while the colored lines visualize the change in marker importance (MI) for patients with different survival times. MI lines are scaled between zero and one. Only deceased patients were included in this analysis (Breast: n = 487, Head and Neck: n = 512, Liver: n = 451, Lung: n = 2,753). Source data
Extended Data Fig. 9
Extended Data Fig. 9. xKM curves for diagnostic markers (TTNT).
xKM curves show the progress of marker contribution for the prediction of time-to-next-treatment (TTNT) for markers along disease progression. Black lines represent Kaplan-Meier plots, while the colored lines visualize the change in marker importance (MI) for patients with different survival times. MI lines are scaled between zero and one. Only deceased patients were included in this analysis (Pan-cancer: n = 10,088, Breast: n = 729, Head and Neck: n = 593, Liver: n = 534, Lung: n = 3,105, Testis: 73). Source data
Extended Data Fig. 10
Extended Data Fig. 10. xKM curves for tumor-specific markers (TTNT).
xKM curves show the progress of marker contribution for the prediction of time-to-next-treatment (TTNT) for tumor-specific markers along disease progression. Black lines represent Kaplan-Meier plots, while the colored lines visualize the change in marker importance (MI) for patients with different survival times. MI lines are scaled between zero and one. Only deceased patients were included in this analysis (Breast: n = 729, Head and Neck: n = 593, Liver: n = 534, Lung: n = 3,105). Source data

Similar articles

Cited by

References

    1. Lipkova, J. et al. Artificial intelligence for multimodal data integration in oncology. Cancer Cell40, 1095–1110 (2022). - PMC - PubMed
    1. Ravdin, P. M. et al. Computer program to assist in making decisions about adjuvant therapy for women with early breast cancer. J. Clin. Oncol. 19, 980–991 (2001). - PubMed
    1. Paik, S. et al. A multigene assay to predict recurrence of tamoxifen-treated, node-negative breast cancer. N. Engl. J. Med.351, 2817–2826 (2004). - PubMed
    1. Acosta, J. N., Falcone, G. J., Rajpurkar, P. & Topol, E. J. Multimodal biomedical AI. Nat. Med.28, 1773–1784 (2022). - PubMed
    1. Katzman, J. L. et al. DeepSurv: personalized treatment recommender system using a Cox proportional hazards deep neural network. BMC Med. Res. Methodol.18, 24 (2018). - PMC - PubMed

Substances

LinkOut - more resources