. 2025 Jan 30;25(1):129.
doi: 10.1186/s12870-025-06130-8.

Differences and driving factors of leaf functional traits between old tree and mature tree of Pinus tabulaeformis in the Loess Plateau

Affiliations

Differences and driving factors of leaf functional traits between old tree and mature tree of Pinus tabulaeformis in the Loess Plateau

Yuting Lei et al. BMC Plant Biol. .

Abstract

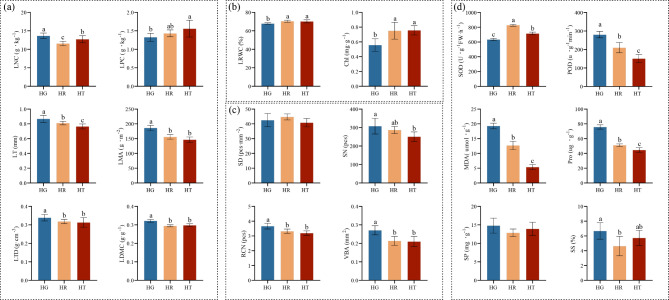
Background: Study the leaf functional traits is highly important for understanding the survival strategies and climate adaptability of old trees. In this study, the old (over 100 years old) and mature trees (about 50 years old) of Pinus tabulaeformis in the Loess Plateau were studied, and the variation of 18 leaf functional traits (6 economic, 4 anatomical, 2 photosynthetic and 6 physiological traits) was analyzed to understand the differences of survival strategies between old and mature trees. Combined with transcriptome and simple sequence repeats (SSR) techniques, the effects of soil property factors and genetic factors on leaf functional traits and the potential molecular mechanisms of traits differences were studied.

Results: Compared with mature trees, old trees presented greater economic traits (except leaf phosphorus content), anatomical traits (except the stomatal density), and physiological traits (except superoxide dismutase activity) and lower photosynthetic traits, and their survival strategies were more conservative. The difference was mainly driven by soil property and genetic factors (common explanation rate was 67.89%), and the independent effect of genetic factors (10.09%) was slightly higher than that of soil property factors (2.88%). In addition, by constructing weighted gene co-expression networks analysis WGCNA), this research identified 24 candidate hub genes that regulate leaf functional traits, most of which are related to plant growth and development and the stress response, and can be used for further regulatory mechanism analysis.

Conclusions: In conclusion, this study is helpful to understand the ecological adaptability of P. tabuliformis under the background of climate change in the Loess Plateau, and provides a theoretical basis related to leaf functional traits and molecular regulation for the protection of old trees.

Keywords: Arid and semi-arid regions; Environmental adaptation; Plant survival strategy; Trade-offs; WGCNA.


Conflict of interest statement

Declarations. Ethics approval and consent to participate: This article does not contain any studies with human participants or animals and did not involve any endangered or protected species. The plant materials sampled and experiments performed in this research were conducted in accordance with local legislation. Consent for publication: Not applicable. Clinical trial number: Not applicable. Competing interests: The authors declare no competing interests.

Figures

Fig. 1
Fig. 1
Histogram of (a) economic traits, (b) photosynthetic traits, (c) anatomical traits, and (d) physiological traits of 3 populations. Different letters indicated significant differences in leaf traits among different populations (LSD test, P < 0.05). LNC, leaf nitrogen content; LPC, leaf phosphorus content; LT, leaf thickness; LMA, leaf mass per area; LTD, leaf tissue density; LDMC, leaf dry matter content; LRWC, leaf relative water content; Chl, chlorophyll content; SD, stomatal density; SN, stomatal number; RCN, resin canal number; VBA, vascular tissue area; SOD, superoxide dismutase activity; POD, peroxidase activity; MDA, malondialdehyde content; Pro, proline content; SP, soluble protein content; SS, soluble sugar content
Fig. 2
Fig. 2
Heat maps of leaf functional traits of (a) old trees, (b) artificial forests, and (c) natural secondary forests. ***P < 0.001; **P < 0.01; *P < 0.05. LNC, leaf nitrogen content; LPC, leaf phosphorus content; LT, leaf thickness; LMA, leaf mass per area; LTD, leaf tissue density; LDMC, leaf dry matter content; LRWC, leaf relative water content; Chl, chlorophyll content; SD, stomatal density; SN, stomatal number; RCN, resin canal number; VBA, vascular tissue area; SOD, superoxide dismutase activity; POD, peroxidase activity; MDA, malondialdehyde content; Pro, proline content; SP, soluble protein content; SS, soluble sugar content
Fig. 3
Fig. 3
Principal components analyses (PCA) of community-level (a) old trees, (b) artificial forests, and (c) natural secondary forests. LNC, leaf nitrogen content; LPC, leaf phosphorus content; LT, leaf thickness; LMA, leaf mass per area; LTD, leaf tissue density; LDMC, leaf dry matter content; LRWC, leaf relative water content; Chl, chlorophyll content; SD, stomatal density; SN, stomatal number; RCN, resin canal number; VBA, vascular tissue area; SOD, superoxide dismutase activity; POD, peroxidase activity; MDA, malondialdehyde content; Pro, proline content; SP, soluble protein content; SS, soluble sugar content
Fig. 4
Fig. 4
Analysis of driving factors of difference of leaf functional traits. (a) RDA ranking of leaf functional traits by environmental factors. ***P < 0.001; **P < 0.01; *P < 0.05. (b) Principal coordinate analysis for 3 populations of P. tabuliformis. (c) UPGMA dendrogram of P. tabuliformis germplasm resources. (d) VPA analysis of soil property and genetic factors. W, the soil moisture content; SOC, the content of the soil organic matter; TP, the soil total phosphorus content; TK, the soil total potassium content; AP, the soil available phosphorus; AK, the soil available potassium; NO3-N, the soil nitrate nitrogen; NH4+-N, the soil ammonium nitrogen; pH, soil pH; C/N, ratio of soil carbon to nitrogen content
Fig. 5
Fig. 5
Correlation analysis of leaf functional traits and transcriptomics. (a) Dendrogram showing co-expression modules (clusters) identified by WGCNA. The major tree branches constitute 28 modules labeled with different colors. (b) Heat maps showing module-trait correlations. Each row corresponds to a module in a different color. Each column corresponds to a functional trait. Red color indicates a positive correlation between the cluster and the tissue. Blue color indicates a negative correlation
Fig. 6
Fig. 6
Pathway enrichment analysis of three important modules. (a) MEblue module, (b) MEdarkred module, and (c) MEsalmon module
Fig. 7
Fig. 7
Analyzing the interactions between hub gene networks within the co-expression module. (a) Interaction analysis of core genes in the MEblue module, (b) Interaction analysis of core genes in the MEdarkred module, and (c) Interaction analysis of core genes in the MEsalmon module

References

    1. Chan D, Wu Q. Significant anthropogenic-induced changes of climate classes since 1950. Sci Rep. 2015;5(1):13487. - PMC - PubMed
    1. Heilmayr R, Dudney J, Moore FC. RETRACTED: Drought sensitivity in mesic forests heightens their vulnerability to climate change. Science. 2023;382(6675):1171–7. - PubMed
    1. Wang L, Cui J, Jin B, Zhao J, Xu H, Lu Z, Li W, Li X, Li L, Liang E, et al. Multifeature analyses of vascular cambial cells reveal longevity mechanisms in old < i > Ginkgo biloba trees. Proc Natl Acad Sci. 2020;117(4):2201–10. - PMC - PubMed
    1. Cannon CH, Piovesan G, Munné-Bosch S. Old and ancient trees are life history lottery winners and vital evolutionary resources for long-term adaptive capacity. Nat Plants. 2022;8(2):136–45. - PubMed
    1. Yang B, Qin C, Wang J, He M, Melvin TM, Osborn TJ, Briffa KR. A 3,500-year tree-ring record of annual precipitation on the northeastern tibetan Plateau. Proc Natl Acad Sci. 2014;111(8):2903–8. - PMC - PubMed

LinkOut - more resources