

Novel predictive biomarkers for atonic postpartum hemorrhage as explored by proteomics and metabolomics
- PMID: 39885444
- PMCID: PMC11781051
- DOI: 10.1186/s12884-025-07224-9
Novel predictive biomarkers for atonic postpartum hemorrhage as explored by proteomics and metabolomics
Abstract
Background: Postpartum hemorrhage (PPH) is the leading cause of maternal mortality worldwide, with uterine atony accounting for approximately 70% of PPH cases. However, there is currently no effective prediction method to promote early management of PPH. In this study, we aimed to screen for potential predictive biomarkers for atonic PPH using combined omics approaches.
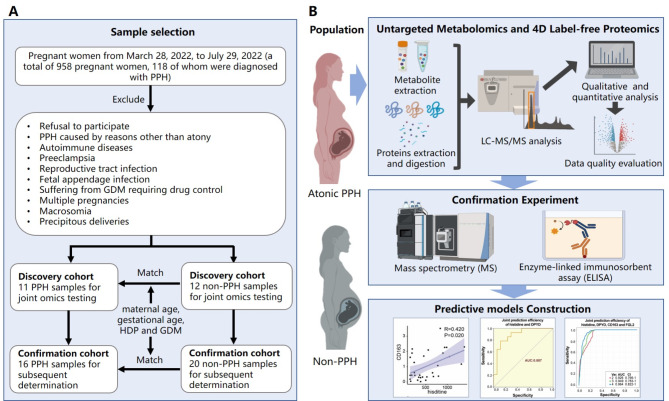
Methods: Collection of cervicovaginal fluid (CVF) samples from 27 women with atonic PPH and 32 women with normal delivery was performed for metabolomic (LC-MS/MS) and proteomic (LC-MS/MS) detection and subsequent confirmation experiments in this nested case-control study. Mass spectrum and enzyme-linked immunosorbent assays (ELISA) were used to validate significantly different metabolites and proteins for screening potential biomarkers of atonic PPH. Furthermore, multivariate logistic regressions were performed for the prediction of PPH using the identified biomarkers mentioned above, and the area under the curve (AUC) was computed.
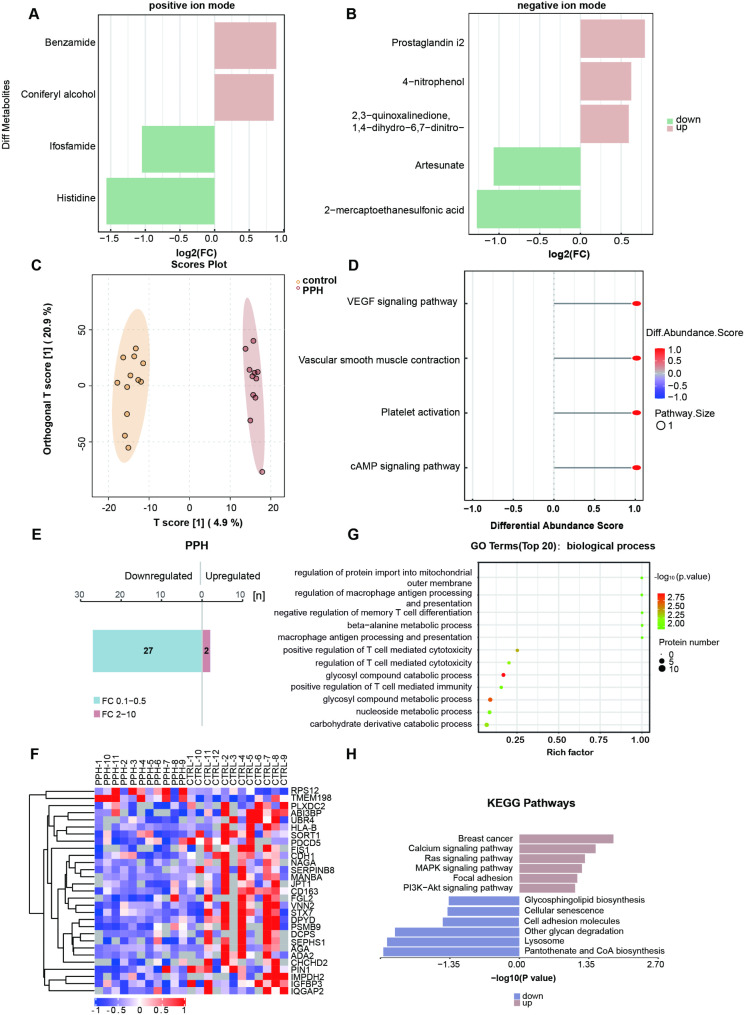
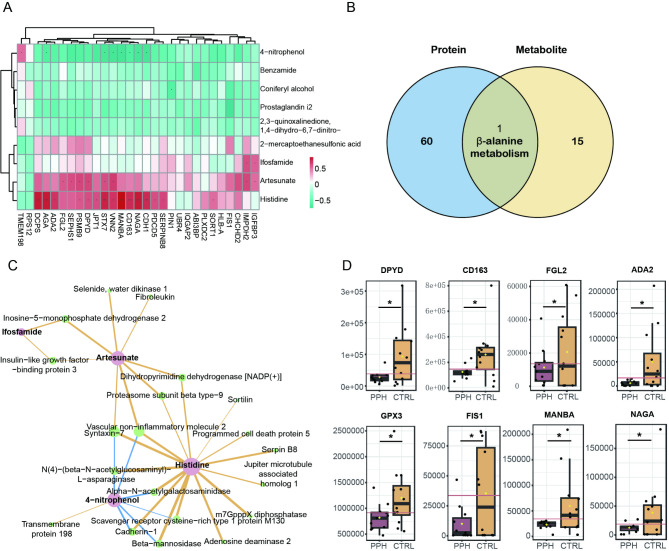
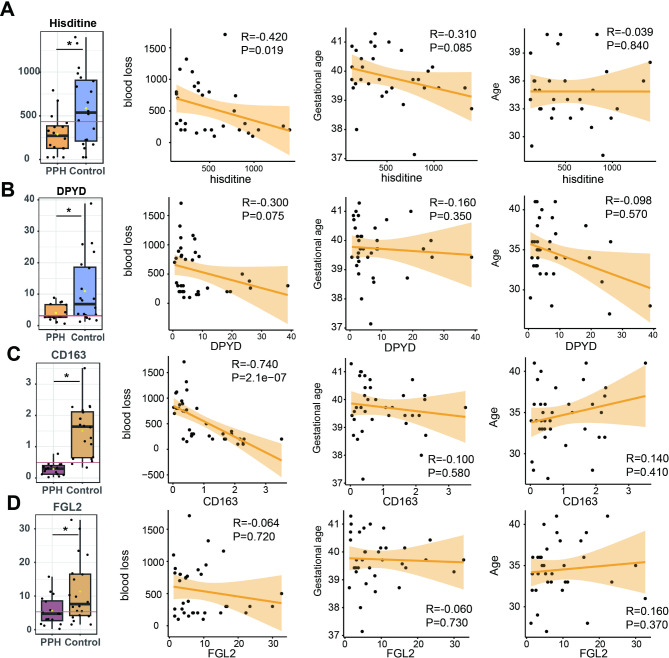
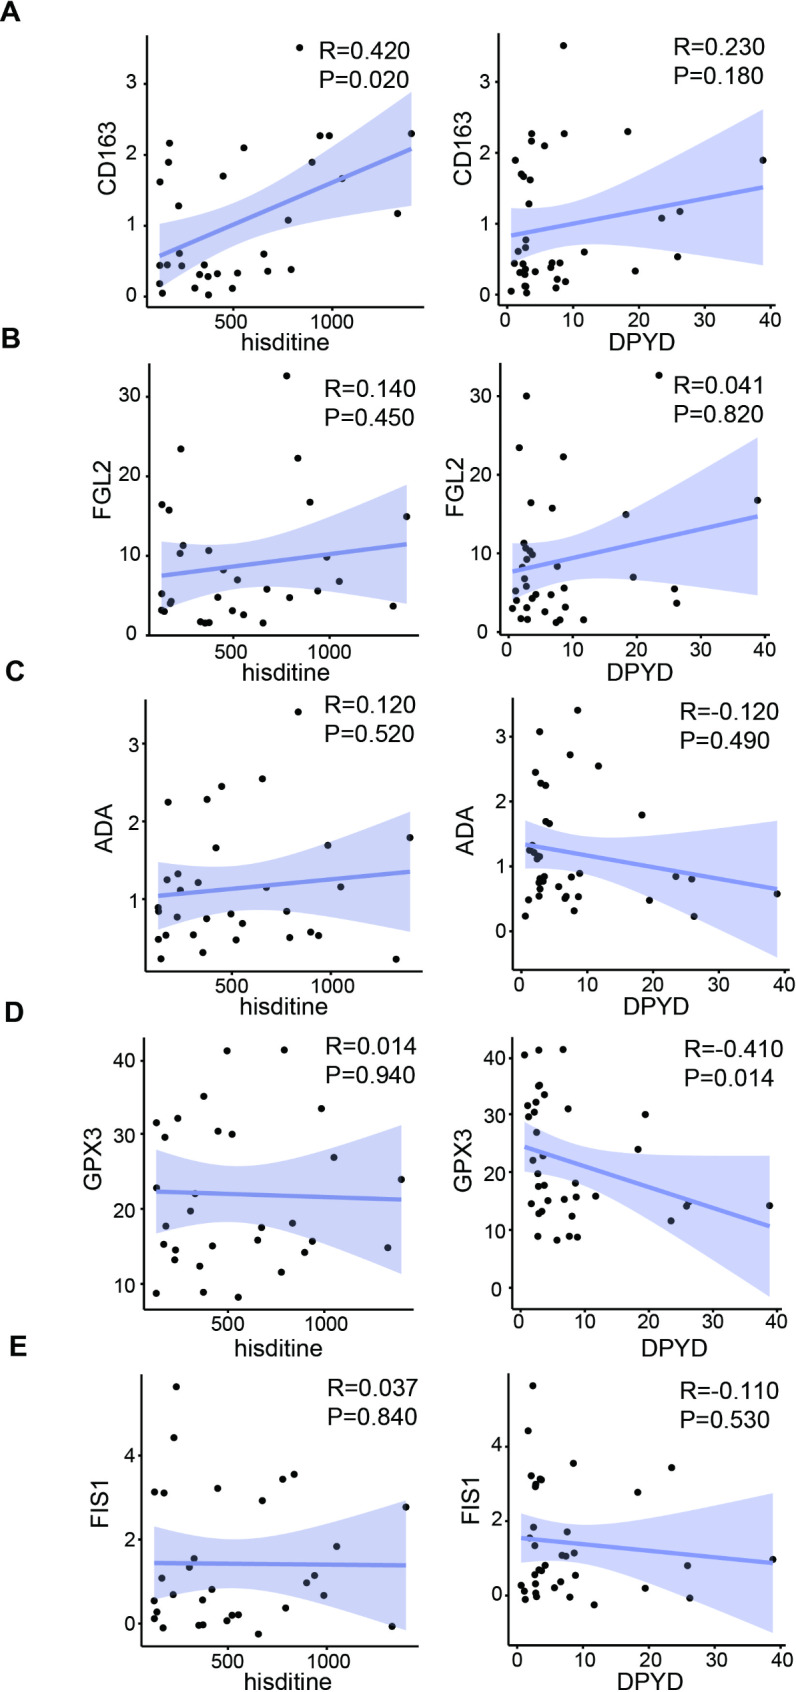
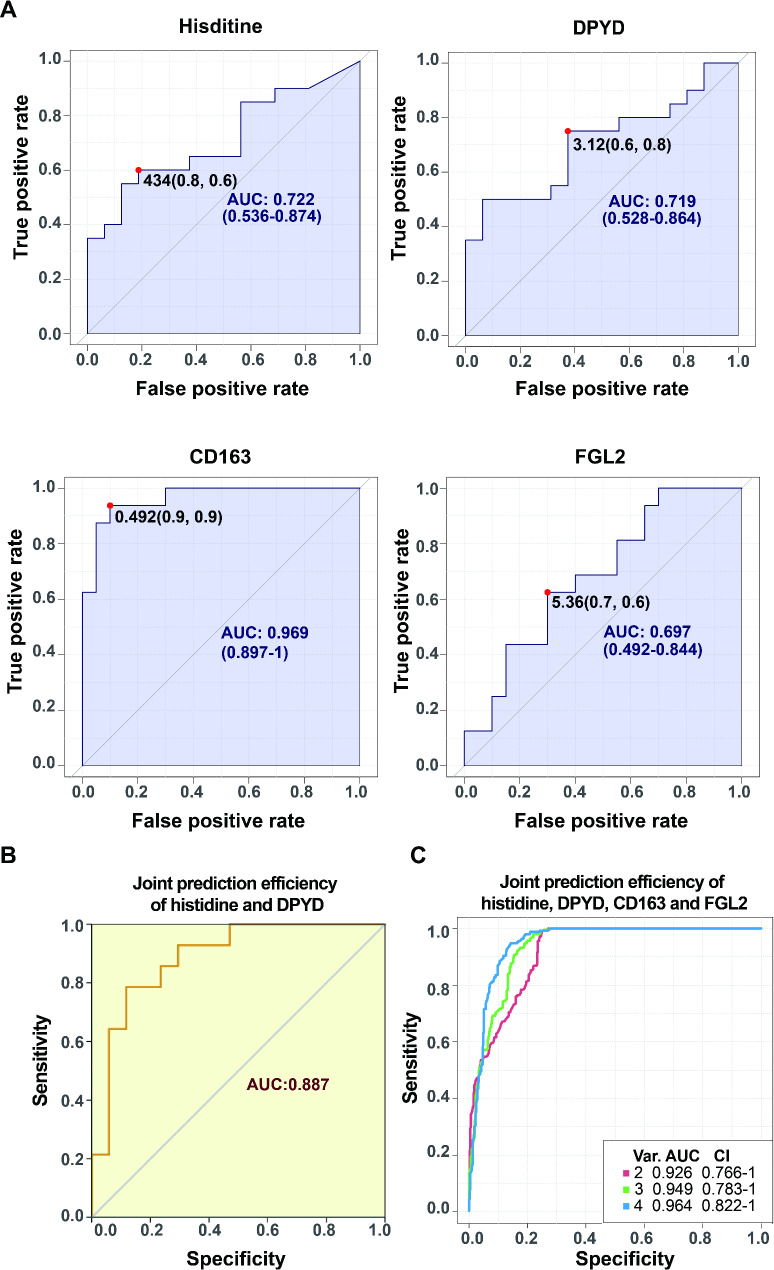
Results: We identified 216 and 311 metabolites under positive and negative ion modes, respectively, as well as 1974 proteins. The PPH group had significant differences in metabolites and proteins belonging to the β-alanine metabolic pathway. Specifically, the PPH group had downregulation of critical metabolites, including histidine and protein dihydropyrimidine dehydrogenase (DPYD). Kyoto Encyclopedia of Genes and Genomes (KEGG) and Gene Ontology (GO) functional enrichment analysis of significantly differentially expressed proteins revealed that atonic PPH was associated with T cell- and macrophage-related immune inflammatory responses. Furthermore, we verified that concentrations of histidine (350.85 ± 207.87 vs. 648.33 ± 400.87) and DPYD (4.01 ± 2.56 vs. 10.96 ± 10.71), and immune cell-related proteins such as CD163 (0.29 ± 0.19 vs. 1.51 ± 0.83) and FGL2 (5.98 ± 4.23 vs. 11.37 ± 9.42) were significantly lower in the PPH group. Finally, the AUC for independent prediction of PPH using CD163, histidine, DPYD, and FGL2 are 0.969 (0.897-1), 0.722 (0.536-0.874), 0.719 (0.528-0.864), and 0.697 (0.492-0.844), respectively. A relatively high predictive efficiency was obtained when using joint histidine, DPYD, CD163, and FGL2, with AUC = 0. 964 (0.822-1).
Conclusions: This study suggested that immune inflammation may play a role in the occurrence of PPH. The metabolite histidine and proteins of DPYD, CD163, and FGL2 in CVF were associated with uterine atony and could be used as predictive biomarkers for atonic PPH.
Keywords: Atonic postpartum hemorrhage; Maternal mortality; Metabonomic; Prediction; Proteomic.
© 2025. The Author(s).
Conflict of interest statement
Declarations. Ethics approval and consent to participate: The Medical Science Research Ethics Committee of Peking University Third Hospital reviewed and approved all the study procedures (M2021685). All mothers were fully informed of the content and purpose of the study and provided written informed consent. This research was conducted in accordance with the Declaration of Helsinki. Consent for publication: Not applicable. Competing interests: The authors declare no competing interests. Clinical trial number: Not applicable.
Figures
Similar articles
-
Early potential metabolic biomarkers of primary postpartum haemorrhage based on serum metabolomics.Ginekol Pol. 2019;90(10):607-615. doi: 10.5603/GP.2019.0105. Ginekol Pol. 2019. PMID: 31686419
-
Novel biomarkers for prediction of atonic postpartum hemorrhage among 'low-risk' women in labor.Front Immunol. 2024 Jul 11;15:1416990. doi: 10.3389/fimmu.2024.1416990. eCollection 2024. Front Immunol. 2024. PMID: 39055706 Free PMC article.
-
Oxidative stress-mediated abnormal polarization of decidual macrophages promotes the occurrence of atonic postpartum hemorrhage.Redox Biol. 2025 Apr;81:103530. doi: 10.1016/j.redox.2025.103530. Epub 2025 Feb 8. Redox Biol. 2025. PMID: 40010137 Free PMC article.
-
Trends in postpartum hemorrhage in high resource countries: a review and recommendations from the International Postpartum Hemorrhage Collaborative Group.BMC Pregnancy Childbirth. 2009 Nov 27;9:55. doi: 10.1186/1471-2393-9-55. BMC Pregnancy Childbirth. 2009. PMID: 19943928 Free PMC article. Review.
-
Uterine atony.Curr Opin Obstet Gynecol. 2022 Apr 1;34(2):82-89. doi: 10.1097/GCO.0000000000000776. Curr Opin Obstet Gynecol. 2022. PMID: 35102109 Review.
References
-
- Say L, Chou D, Gemmill A, Tunçalp Ö, Moller AB, Daniels J, et al. Global causes of maternal death: a WHO systematic analysis. Lancet Glob Health. 2014;2(6):e323–33. - PubMed
-
- Jiang H, Shi HF, Chen L, Yang J, Yuan PB, Wang W et al. Is there a relationship between plasma, cytokine concentrations, and the subsequent risk of postpartum hemorrhage? Am J Obstet Gynecol. 2022;226(6):835.e1-835.e17. - PubMed
-
- Farhana M, Tamura N, Mukai M, Ikuma K, Koumura Y, Furuta N, et al. Histological characteristics of the myometrium in the postpartum hemorrhage of unknown etiology: a possible involvement of local immune reactions. J Reprod Immunol. 2015;110:74–80. - PubMed
-
- Palmieri O, Mazza T, Castellana S, Panza A, Latiano T, Corritore G, et al. Inflammatory bowel Disease meets systems Biology: a Multi-omics Challenge and Frontier. Omics. 2016;20(12):692–8. - PubMed
MeSH terms
Substances
Grants and funding
LinkOut - more resources
Full Text Sources
Research Materials
Miscellaneous
