Observational Study
. 2025 Jan 30;23(1):138.
doi: 10.1186/s12967-024-06040-7.

Multiomics unravels the complexity of male obesity: a prospective observational study

Affiliations
Observational Study

Multiomics unravels the complexity of male obesity: a prospective observational study

Georgios E Papadakis et al. J Transl Med. .

Abstract

Background: Obesity is associated with varying degrees of metabolic dysfunction. In this study, we aimed to discover markers of the severity of metabolic impairment in men with obesity via a multiomics approach.

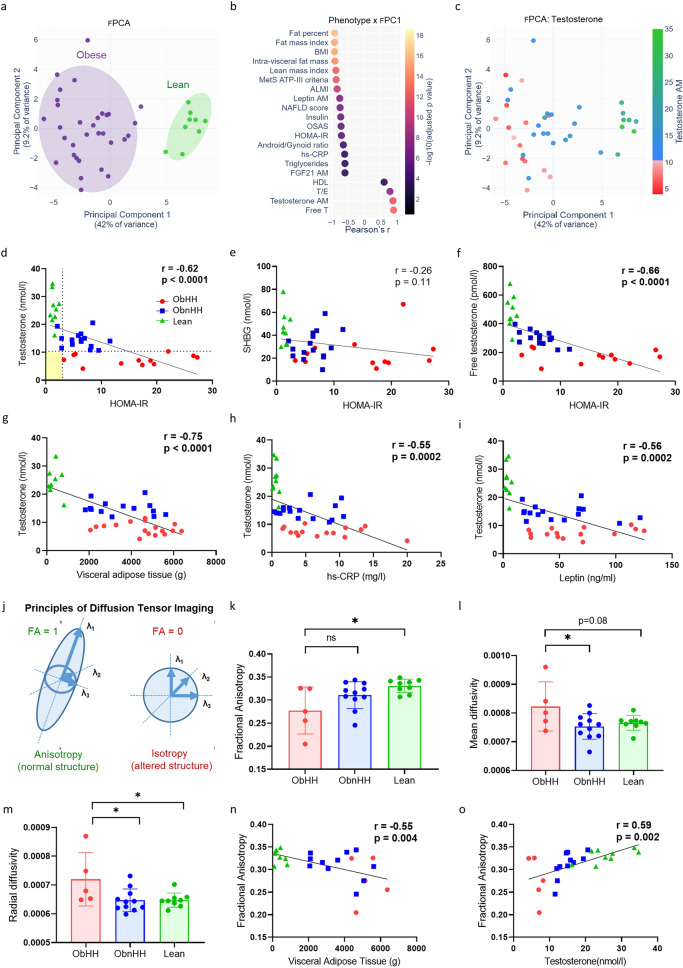
Methods: Thirty-two morbidly men with obesity who were candidates for Roux-en-Y gastric bypass (RYGB) surgery were prospectively followed. Nine healthy adults served as controls. Deep phenotyping, including targeted metabolomics, transcriptomics, and brain magnetic resonance imaging (MRI), was performed.

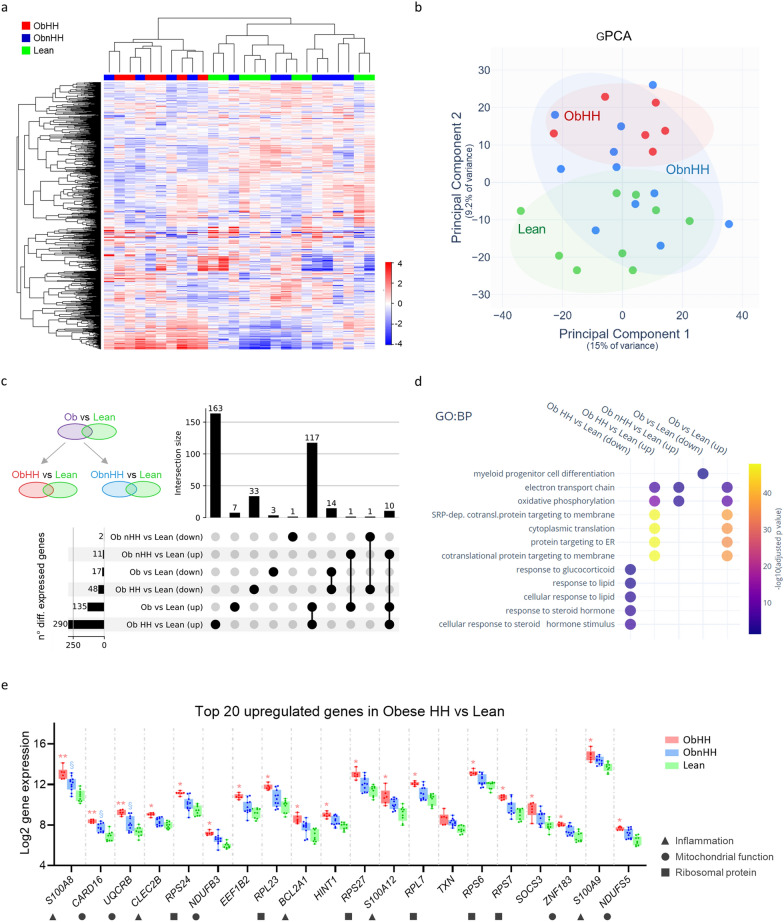
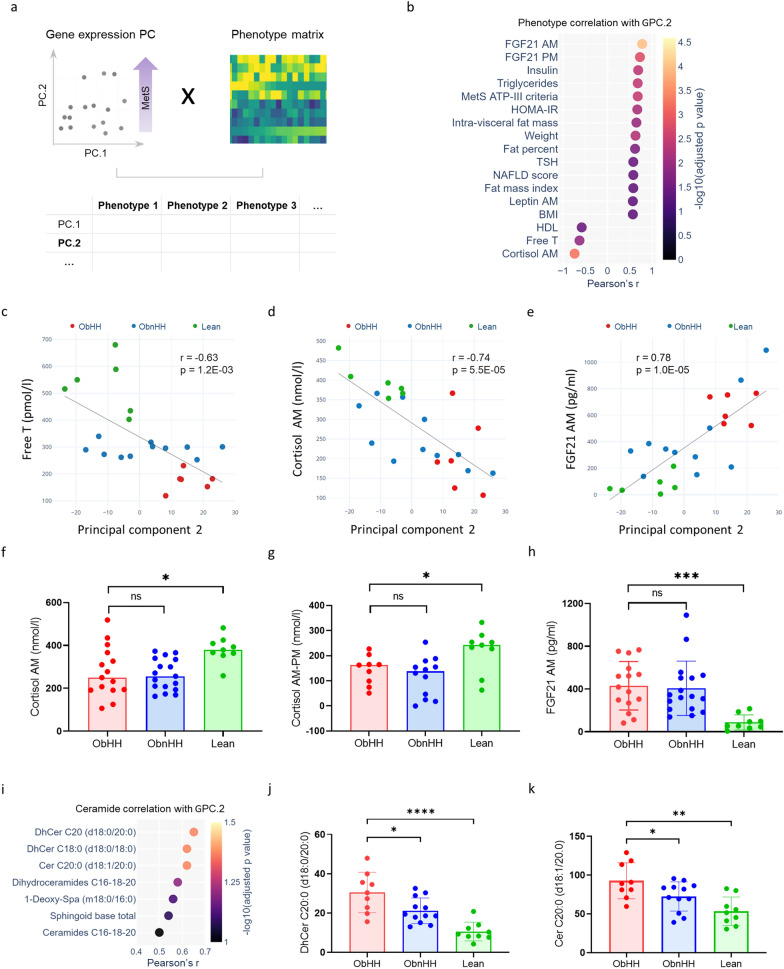
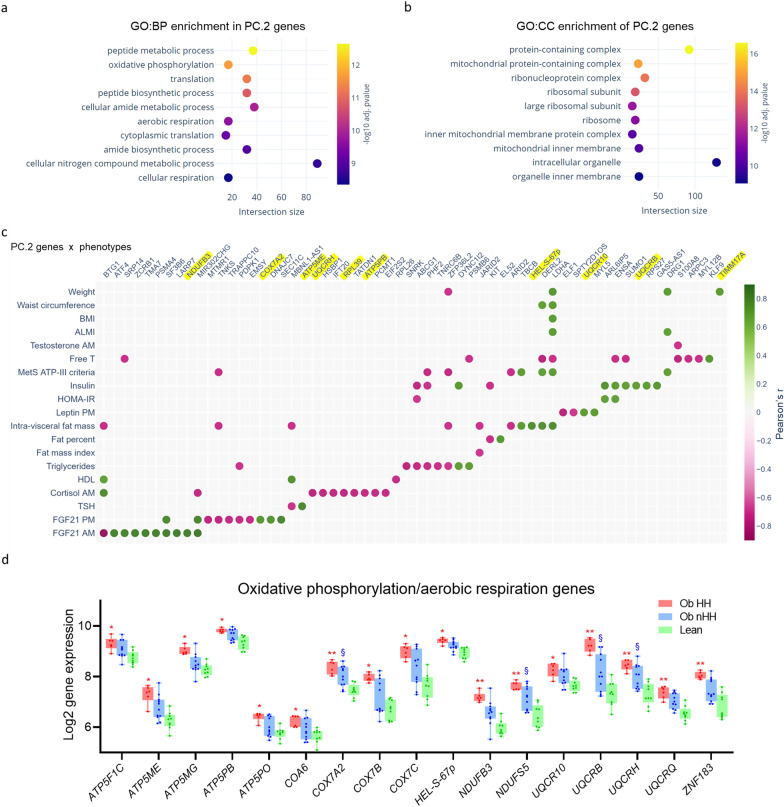
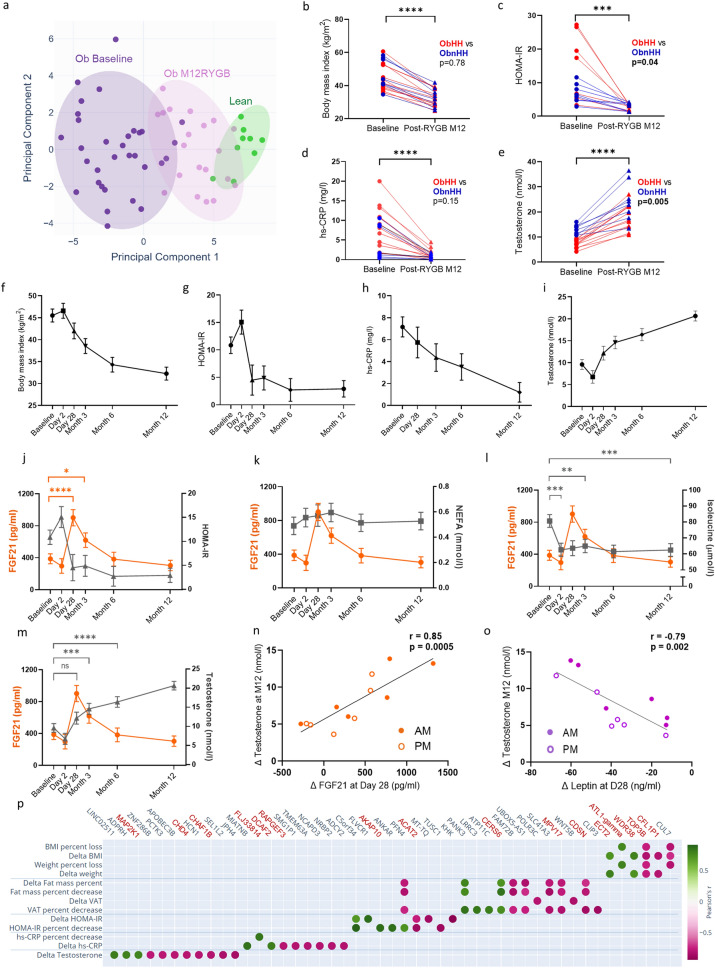
Results: Testosterone emerged as a key contributor to phenotypic variability via principal component analysis and was therefore used to further categorize obese patients as having or not having hypogonadotropic hypogonadism (HH). Despite having comparable body mass indices, obese individuals with HH presented with worse metabolic defects than obese individuals without HH, including higher insulin resistance, as well as MRI signs of hypothalamic inflammation and a specific blood transcriptomics signature. The upregulated genes were involved mainly in inflammation, mitochondrial function, and protein translation. Integration of gene expression and clinical data revealed high FGF21 and low cortisol levels as the top markers correlated with the transcriptomic signature of metabolic risk. Following RYGB-induced substantial weight loss, testosterone levels markedly increased in both obese individuals with and without HH, challenging the current definition of hypogonadism. A longitudinal study in a subset of men with obesity following bariatric surgery revealed a unique FGF21 trajectory with a sharp peak at one month post-RYGB that correlated with metabolic and reproductive improvements.

Conclusions: Combining clinical, biochemical, and molecular markers allows adequate stratification of metabolic risk in men with obesity and provides novel tools for personalized care.

Keywords: Bariatric surgery; Hypogonadism; Male obesity; Metabolic risk stratification; Transcriptomics.


Conflict of interest statement

Declarations. Ethics approval and consent to participate: The research protocol was approved by the Institutional Ethics Committee for Research of the Canton of Vaud, Switzerland (CER-VD), and written informed consent was obtained from all participants. Consent for publication: Not applicable. Competing interests: The authors declare that they have no competing interests.

Figures

Fig. 1
Fig. 1
Hypogonadism in men with obesity is associated with worsening metabolic defects and hypothalamic alterations. a Scatter plot representing the first two principal components resulting from PCA of the metabolic and reproductive phenotypes of thirty-two obese patients and nine lean subjects. b Dot plot illustrating the contribution of individual variables (to patient phenotypic variance) measured as their correlation with principal component 1 (PC.1). c Overlay of PCA two first principal components with T levels (colorscale) illustrating a gradient of T along PC.1. d Scatter plot of the HOMA-IR index with T levels. The participants are represented as follows: Obese with HH (ObHH, red circles, n = 12), Obese without HH (ObnHH, blue squares, n = 16), and Lean (green triangles, n = 9). Missing values of HOMA-IR are due to hemolyzed blood samples in two patients (one ObHH and one ObnHH) and exogenous insulin therapy in two ObHH men. Regression lines, Pearson correlation coefficients (r) and related p values are shown. The light yellow rectangle reflects the inability to detect any patient with HH (T < 10.4 nmol/l, horizontal dashed line) and normal insulin sensitivity (HOMA-IR < 3.0, vertical dashed line). e, f Scatter plots of the HOMA-IR index with the levels of SHBG and FT as calculated by the Vermeulen formula. gi Linear regression model showing the relationships between T levels and visceral adipose tissue (n = 39), serum hs-CRP (n = 40), and plasma leptin (n = 40) levels. j Principles of DTI illustrating that fractional anisotropy is a marker of preserved (high value, green) or altered structure (low value, red). k-m) Between-group comparisons of fractional anisotropy, mean diffusivity, and radial diffusivity levels (subjects included in Protocol 2; see Methods: Obese n = 16 vs Lean n = 9). n, o Linear regression model representing the relationship between fractional anisotropy vs visceral adipose tissue and serum T levels. * p < 0.05; ** p < 0.01; *** p < 0.001; **** p < 0.0001; ns not significant
Fig. 2
Fig. 2
Hypogonadal and eugonadal men with obesity display different degrees of altered gene expression. a Heatmap representing the relative expression (Z score) of the top 1000 variable genes followed by hierarchical clustering on the basis of correlation (complete linkage). The centers of genes and samples were obtained by subtracting their means. b Scatter plot representing the first two principal components resulting from PCA on all detected genes. Obese patients with hypogonadotropic hypogonadism (ObHH, n = 6), obese patients without hypogonadotropic hypogonadism (ObnHH, n = 11) and lean controls (Lean, n = 9) are displayed in red, blue, and green, respectively. c UP plot illustrating the number of differentially expressed genes and their intersections according to the comparisons used in the differential gene expression analysis (upper left schematics). d Dot plot illustrating the enrichment of gene ontology biological processes (GO:BP) in differentially expressed genes. e Expression of the top 20 upregulated genes in obese HH patients versus lean controls. *p < 0.001, **p < 1.0 × 107, §p < 0.05
Fig. 3
Fig. 3
Transcriptomics highlights FGF21 and cortisol levels as markers of metabolic dysfunction beyond hypogonadism. a Schematics illustrating the strategy used to correlate individual phenotype variables with patient transcriptomic data in the form of principal component 2 from gene expression data (gPC.2). b Dot plot illustrating the correlation of individual phenotypic variables with patients’ transcriptomic data, measured as their correlation with gPC.2. ce Scatter plots representing individual phenotypic variables such as FT (c), morning cortisol (d), and fasting FGF21 e as functions of gene expression PC.2. Obese patients with hypogonadotropic hypogonadism (ObHH), obese patients without hypogonadotropic hypogonadism (ObnHH), and lean controls (Lean) are displayed in red, blue, and green, respectively. Regression lines, Pearson correlation coefficients (r), and related p values are shown in each plot. fh Between-group comparisons of morning (AM) serum cortisol levels (panel f; Protocol 1), diurnal variation in serum cortisol (by subtracting afternoon [PM] from morning values) levels (panel g; Protocol 2: Obese n = 21, Lean n = 9), and fasting plasma AM FGF21 levels (panel h, Protocol 1). i Dot plot illustrating the associations of individual ceramides with transcriptomic variability, evaluated as the correlations of individual plasma ceramide species with gPC.2. The top three classes were long acyl chain (C18 and C20) ceramides and dihydroceramides. j, k DhCer and Cer C20:0 levels, both of which were higher in ObHH than in both ObnHH and Lean; ****p < 0.0001; ***p < 0.001; **p < 0.01; *p < 0.05; ns not significant
Fig. 4
Fig. 4
Genes involved in peptide metabolic processes, oxidative phosphorylation and aerobic respiration correlate with the phenotypic signatures of metabolic syndrome. Functional enrichment analysis of Principal Component 2 (PC.2) genes in the Gene Ontology database reveals enriched biological processes a and cellular components b linked with cellular metabolism. c Dot plot illustrating the correlation of individual phenotypic variables with the expression of PC.2 genes from patients’ transcriptomic data. The genes involved in oxidative phosphorylation/aerobic respiration are highlighted in yellow. d Expression of PC.2 genes involved in oxidative phosphorylation/aerobic respiration in both the obese groups and lean controls. *p < 0.05 and **p < 1.0 × 10–4 (ObHH vs Lean); § p < 0.05 (ObnHH vs Lean)
Fig. 5
Fig. 5
Metabolic and reproductive improvements following bariatric surgery are closely associated with early increases in plasma FGF21 levels. a RYGB induced significant phenotypic changes, as illustrated by a rightward shift along Principal Component 1 (PC.1) from phenotypic PCA (fPCA). Compared with the baseline obese group (dark purple, n = 32), men at month 12 (M12) post RYGB (light purple, n = 20) were healthier (green, n = 9). be Changes in BMI, HOMA-IR, hs-CRP, and serum T levels throughout one year post-RYGB in 20 men with obesity. Each line corresponds to an individual patient (obese with hypogonadotropic hypogonadism [ObHH] and obese without hypogonadotropic hypogonadism [ObnHH] in red and blue, respectively). Brackets show the extent of the difference between the baseline and M12 post-RYGB groups as a whole. In addition, the comparison of the relative percent change in these outcomes according to the gonadal status at baseline is shown in the upper right quadrant of each graph. fi Longitudinal evolution of the same parameters in nine participants who consented to multiple post-RYGB visits via linear mixed model regression. Owing to missed visits, data were available for eight participants on Day 2 and Month 3 and for six participants on Day 28. All four parameters showed significant changes beginning on Day 28. j Post-RYGB FGF21 changes (orange line, left Y axis) overlaid with HOMA-IR shifts (gray line, right Y axis). Brackets in orange illustrate the timepoints with significant differences in plasma FGF21 levels compared with those at baseline. kl Temporal associations of post-RYGB FGF21 changes in orange (left Y-axis) with serum nonesterified fatty acid (NEFA, panel k) and plasma isoleucine levels (panel l), both of which are shown in gray (right Y-axis). m) Superimposition of FGF21 changes (orange line, left Y axis) and recovery of serum T levels (gray line, right Y axis). n, o Linear regression model representing the relationship of the postbariatric change in plasma FGF21 and leptin levels from baseline to Day 28 with the change in serum T levels from baseline to M12. For each outcome, the difference (Δ, delta) was calculated for both fasting at 8 AM (full circles) and afternoon samples at 3 PM (empty circles). p Dot plot illustrating the top-ranked correlation relationships of clinical variables reflecting post-RYGB recovery with VAT gene expression. The genes with known associations with metabolic or reproductive traits are shown in red. The results in graphs f-m) are shown as the means ± standard errors. ****p < 0.0001; ***p < 0.001; **p < 0.01; *p < 0.05; ns not significant

Similar articles

References

    1. Collaborators GBDO, Afshin A, Forouzanfar MH, Reitsma MB, Sur P, Estep K, et al. Health effects of overweight and obesity in 195 countries over 25 years. N Engl J Med. 2017;377(1):13–27. - PMC - PubMed
    1. Bluher M. Metabolically healthy obesity. Endocr Rev. 2020. 10.1210/endrev/bnaa004. - PMC - PubMed
    1. Wu FC, Tajar A, Pye SR, Silman AJ, Finn JD, O’Neill TW, et al. Hypothalamic-pituitary-testicular axis disruptions in older men are differentially linked to age and modifiable risk factors: the European Male Aging Study. J Clin Endocrinol Metab. 2008;93(7):2737–45. - PubMed
    1. Vermeulen A, Kaufman JM, Deslypere JP, Thomas G. Attenuated luteinizing hormone (LH) pulse amplitude but normal LH pulse frequency, and its relation to plasma androgens in hypogonadism of obese men. J Clin Endocrinol Metab. 1993;76(5):1140–6. - PubMed
    1. Zitzmann M. Testosterone deficiency, insulin resistance and the metabolic syndrome. Nat Rev Endocrinol. 2009;5(12):673–81. - PubMed

Publication types