. 2025 Jan 30;23(1):131.
doi: 10.1186/s12967-025-06080-7.

Identification and validation of a prognostic signature of drug resistance and mitochondrial energy metabolism-related differentially expressed genes for breast cancer

Affiliations

Identification and validation of a prognostic signature of drug resistance and mitochondrial energy metabolism-related differentially expressed genes for breast cancer

Tiankai Xu et al. J Transl Med. .

Abstract

Background: Drug resistance constitutes one of the principal causes of poor prognosis in breast cancer patients. Although cancer cells can maintain viability independently of mitochondrial energy metabolism, they remain reliant on mitochondrial functions for the synthesis of new DNA strands. This dependency underscores a potential link between mitochondrial energy metabolism and drug resistance. Hence, drug resistance and mitochondrial energy metabolism-related differentially expressed genes (DMRDEGs) may emerge as candidates for novel cancer biomarkers. This study endeavors to assess the viability of DMRDEGs as biomarkers or therapeutic targets for breast cancer.

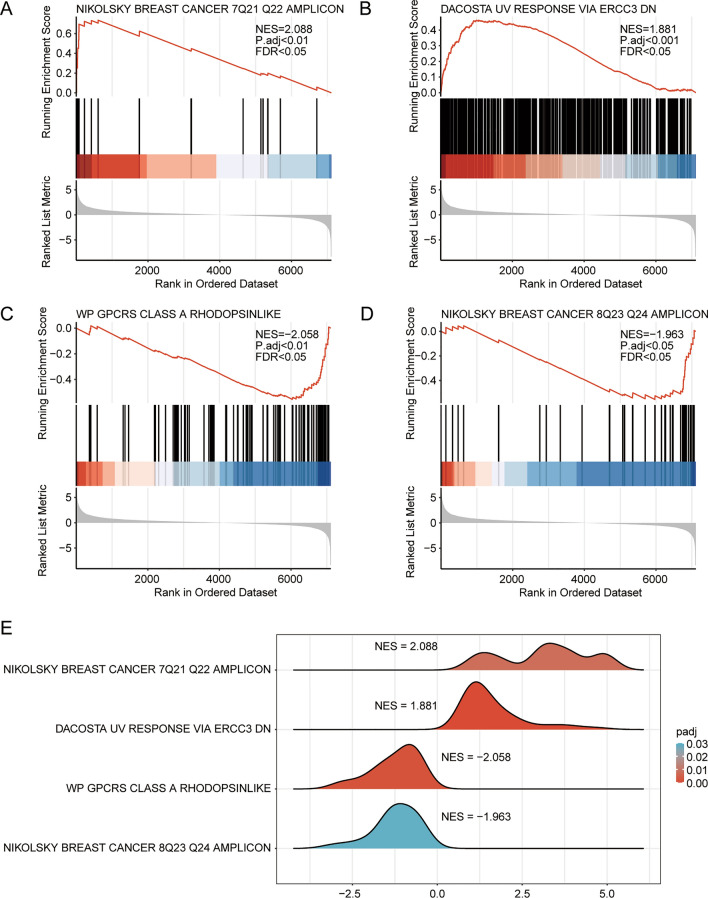
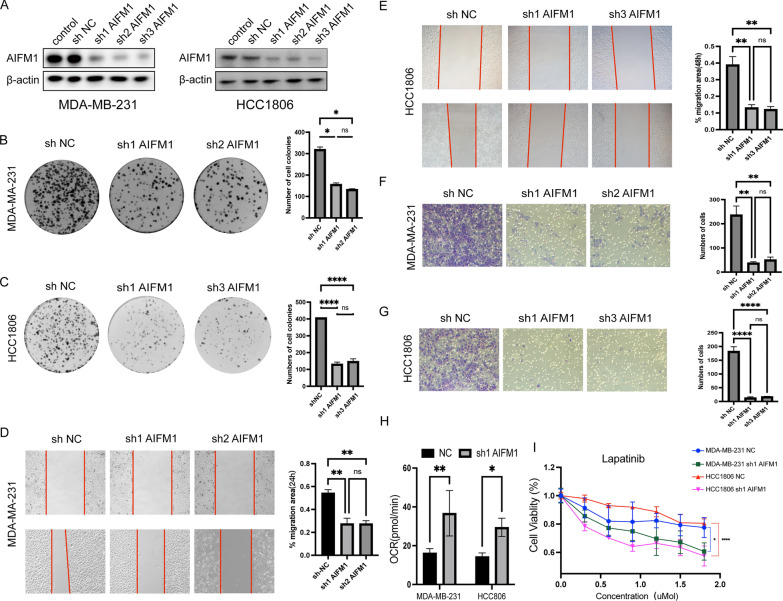
Methods: We utilized the DRESIS database and MSigDB to identify genes related to drug resistance. Additionally, we sourced genes associated with mitochondrial energy metabolism from GeneCards and extant literature. By merging these genes with differentially expressed genes observed in normal and tumor tissues from the TCGA-BRCA and GEO databases, we successfully identified the DMRDEGs. Employing unsupervised consensus clustering, we divided breast cancer patients into two distinct groups based on the DMRDEGs. Consequently, we identified four hub genes to formulate a prognostic model, applying Cox regression, LASSO regression, and Random Forest methods. Furthermore, we examined immune infiltration and tumor mutation burden of the genes within our model and scrutinized divergences in the immune microenvironment between high- and low-risk groups. Small hairpin RNA and lentiviral plasmids were designed for stable transfection of breast cancer cell lines MDA-MB-231 and HCC1806. By conducting clone formation, scratch test, transwell assays, cell viability assay and measurement of oxygen consumption we initiated a preliminary investigation into mechanistic roles of AIFM1.

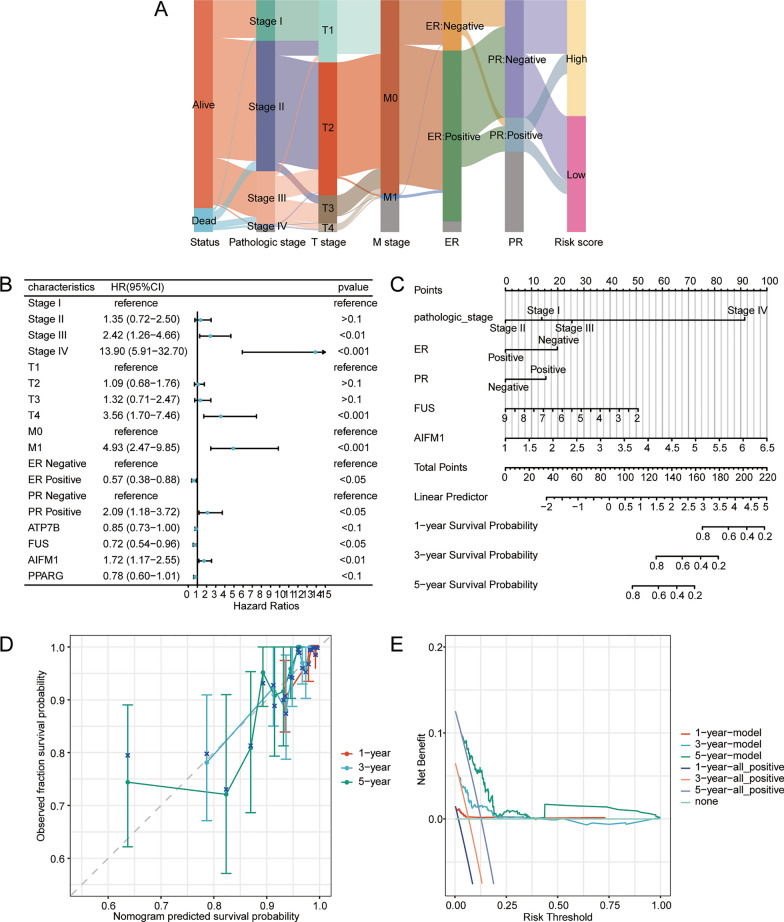
Results: We utilized DMRDEGs to develop a prognostic model that includes four mRNAs for breast cancer. This model combined with various clinical features and critical breast cancer facets, demonstrated remarkable efficacy in predicting patient outcomes. AIFM1 appeared to enhance the proliferation, migration, and invasiveness of breast cancer cell lines MDA-MB-231 and HCC1806. Moreover, by reducing oxygen consumption, it aids in the cancer cells' acquisition of drug resistance.

Conclusions: DMRDEGs hold promise as diagnostic markers and therapeutic targets for breast cancer. Among the associated mutated genes, ATP7B, FUS, AIFM1, and PPARG could serve as early diagnostic indicators, and notably, AIFM1 may present itself as a promising therapeutic target.

Keywords: Breast cancer; Drug resistance; Mitochondrial energy metabolism; Prognostic model.


Conflict of interest statement

Declarations. Consent for publication: All authors confirm their consent for publication the manuscript. Competing interests: The authors declare that there is no conflict of interest.

Figures

Fig. 1
Fig. 1
Differential Gene Expression Analysis. A Volcano plot of differentially expressed genes analysis between Tumor group and Normal group in TCGA-BRCA. B Venn diagram of intersection of DEGs with DRGs and MRGs in TCGA-BRCA. C-D Expression heatmap of DMRDEGs in TCGA-BRCA and Combined Dataset. E Correlation heat map of DMRDEGs in TCGA dataset. F Chromosomal mapping of DMRDEGs. *** indicates p-value < 0.001, ** indicates p-value < 0.01, * indicates p-value < 0.05
Fig. 2
Fig. 2
Mutation Analysis of DMRDEGs in TCGA-BRCA. A Mutation presentation in TCGA-BRCA. B Mutation waterfall plot in DMRDEGs in TCGA-BRCA. C Boxplot and stacked bar plot of TCGA-BRCA mutation types. D Mutation correlation heat map of DMRDEGs in TCGA-BRCA. E KM curve of mutation of DMRDEGs and DSS survival in TCGA-BRCA patients. F CNV of DMRDEGs in TCGA-BRCA
Fig. 3
Fig. 3
GO and KEGG Enrichment Analysis for DMRDEGs. A Bar graph of GO and KEGG enrichment analysis results of joint logFC of DMRDEGs: BP, CC, MF and Pathway. B Bubble plot of GO and KEGG enrichment analysis results of combined logFC of DMRDEGs. C Chordplot of GO and KEGG enrichment analysis results of joint logFC for DMRDEGs. D Circle plot of GO and KEGG enrichment analysis results of combined logFC of DMRDEGs. The screening criteria for GO and KEGG enrichment analysis were p-value < 0.05 and FDR value (q-value) < 0.25
Fig. 4
Fig. 4
Consensus Clustering Analysis for DMRDEGs. A Plot of consensus Clustering results for BRCA. B-C. Cumulative distribution function (CDF) plot (B) and Delta plot (C) of concordance Clustering analysis. D Boxplot of differential genes related to DMRDEGs between the two BRCA subtypes. *** denotes p-value < 0.001, ** denotes p-value < 0.01, and * denotes p-value < 0.05
Fig. 5
Fig. 5
GSEA for TCGA-BRCA Dataset. A-D GSEA showed that BRCA subtypes significantly affected NIKOLSKY BREAST CANCER 7Q21 Q22 AMPLICON (A), DACOSTA UV RESPONSE VIA ERCC3 DN (B), WP GPCRS CLASS A RHODOPSINLIKE (C), NIKOLSKY BREAST CANCER 8Q23 Q24 AMPLICON (D). E. 4 biological function mountain map of GSEA for different disease subtypes in TCGA-BRCA. The screening criteria of GSEA were padj < 0.05 and FDR value (q-value) < 0.25
Fig. 6
Fig. 6
GSVA for TCGA-BRCA. A Heat map of enrichment scores for TCGA-BRCA GSVA. B Boxplot of group comparison of GSVA results among BRCA subtypes. *** indicates p-value < 0.001
Fig. 7
Fig. 7
Immune Infiltration Analysis by CIBERSORT Algorithm. A Stacked bar chart of immune cell infiltration abundance in BRCA subtype 1 (Cluster1) and subtype 2 (Cluster2). B Comparison of immune cell infiltration abundance between BRCA subtype 1 (Cluster1) and subtype 2 (Cluster2). C Heat map of infiltration abundance correlation between immune cells. D Dot plot of correlation between differential genes related to DMRDEGs and abundance of immune cell infiltration. EF Scatter plot of gene-immune cell infiltration abundance correlations with the strongest negative (E, ATP7B and Macrophages M1) and the strongest positive (F, IL1B and Mast cells activated) correlations. *** indicates p-value < 0.001, ** indicates p-value < 0.01, * indicates p-value < 0.05. The absolute value of the correlation coefficient (cor) below 0.3 was weak or no correlation, 0.3–0.5 was weak correlation, 0.5–0.8 was moderate correlation, and above 0.8 was strong correlation
Fig. 8
Fig. 8
ESTIMATE Analysis Between Different BRCA Clusters. A-D Violin plot for comparison of different disease subtypes by Stromal Score (A), Immune Score (B), ESTIMATE Score (C), and Tumor Purity (D) score. *** indicates p-value < 0.001
Fig. 9
Fig. 9
IPS, TMB, TIDE Analysis. D Group comparison of IPS between groups of different BRCA disease subtypes: CTLA4(-)PD1(-) (A), CTLA4(-)PD1( +) (B), CTLA4( +)PD1(-) (C), CTLA4( +)PD1( +) (D). E Group comparison of TMB scores for different disease subtypes of BRCA. F Group comparison of TIDE scores by BRCA disease subtype. *** indicates p-value < 0.001
Fig. 10
Fig. 10
Drug Sensitivity Analysis. A-T. Comparison of drugs MK.2206 (A), Lapatinib (B), AZD8055 (C), WO2009093972 (D), GDC0941 (E), Temsirolimus (F), EHT.1864 (G) among different disease subtypes based on GDSC database. GW.441756 (H), CCT007093 (I), FH535 (J), PF.4708671 (K), PD.0332991 (L), Elesclomol (M), AKT.inhibitor.VIII (N), Pazopanib (O), The group comparison figure of sensitivity analysis results of IPA.3 (P), Axitinib (Q), Metformin (R), NVP.BEZ235 (S), and AMG.706 (T) is shown. *** indicates p-value < 0.001
Fig. 11
Fig. 11
PPI Network. A PPI Network of DMRDEGs calculated from STRING database. B PPI interaction network of DMRDEGs in GeneMANIA database
Fig. 12
Fig. 12
LASSO Analysis for DMRDEGs. A-B Plots of prognostic risk models (A) and variable trajectories (B) from the LASSO regression model. C-D Comparison of expression groups of key genes in TCGA-BRCA and Combined Dataset. E Risk factor plot of LASSO regression model. F 1 -, 3 -, and 5-year time-dependent ROC curves of Risk scores. The abscissa is the false positive rate (FPR) and the ordinate is the true positive rate (TPR). LASSO, Least absolute shrinkage and selection operator; *** indicates p-value < 0.001
Fig. 13
Fig. 13
Survival Analysis for Key Genes and Risk Score. A-D KM curve of survival prognosis in TCGA-BRCA for different expression levels of key genes. E KM curves of survival prognosis for high and low Risk Score groups in TCGA-BRCA
Fig. 14
Fig. 14
Prognostic Model for Cox Regression. A Sankey plot of clinicopathological features. B Clinical characteristics, single factor Cox regression analysis forest plot of four key genes. C-E Prognostic nomogram of multivariate Cox regression model (C), prognostic calibration curve (D), DCA plot (E)
Fig. 15
Fig. 15
Experimental validation of the role of AIFM1 in breast cancer cell lines. A Knockdown efficiency of AIFM1 in MDA-MB-231 and HCC1806 cells. B-C The proliferation ability of MDA-MB-231 and HCC1806 cells was measured by colony formation assay after transfecting AIFM1 shRNAs. D-E Scratch experiment for measuring the migration ability of MDA-MB-231 and HCC1806 cells. F-G. MDA-MB-231 and HCC1806 cell transwell invasion assay were performed in control and sh AIFM1 groups. H The OCR of the MDA-MB-231 and HCC1806 cell lines was assessed following induction by the control and sh AIFM1 group. I Treatment of cancer cells with escalating concentrations of Lapatinib (0.3, 0.6, 0.9, 1.2, 1.5, and 1.8 µM) over a 48-h period resulted in the determination of cell viability, as quantified by CCK-8 assays. *p-value < 0.05; **p-value < 0.01; ****p-value < 0.0001

References

    1. Bray F, Laversanne M, Sung H, Ferlay J, Siegel RL, Soerjomataram I, Jemal A. GLOBOCAN estimates of incidence and mor tality worldwide for 36 cancers in 185 countries. CA Cancer J Clin. 2022. 10.3322/caac.21834.
    1. Loibl S, Poortmans P, Morrow M, Denkert C, Curigliano G. Breast cancer. Lancet. 2021;397:1750–69. - PubMed
    1. Harbeck N, Penault-Llorca F, Cortes J, Gnant M, Houssami N, Poortmans P, Ruddy K, Tsang J, Cardoso F. Breast cancer. Nat Rev Dis Primers. 2019;5:66. - PubMed
    1. Anand U, Dey A, Chandel AKS, Sanyal R, Mishra A, Pandey DK, De Falco V, Upadhyay A, Kandimalla R, Chaudhary A, et al. Cancer chemotherapy and beyond: current status, drug candidates, associated risks and progress in targeted therapeutics. Genes Dis. 2022;10:1367–401. - PMC - PubMed
    1. Schmidt DR, Patel R, Kirsch DG, Lewis CA, Vander Heiden MG, Locasale JW. Metabolomics in cancer research and emerging applications in clinical oncology. CA Cancer J Clin. 2021;71:333–58. - PMC - PubMed

Publication types

LinkOut - more resources