. 2025 Jan 30;7(1):lqaf001.
doi: 10.1093/nargab/lqaf001. eCollection 2025 Mar.

Consistent features observed in structural probing data of eukaryotic RNAs

Affiliations

Consistent features observed in structural probing data of eukaryotic RNAs

Kazuteru Yamamura et al. NAR Genom Bioinform. .

Abstract

Understanding RNA structure is crucial for elucidating its regulatory mechanisms. With the recent commercialization of messenger RNA vaccines, the profound impact of RNA structure on stability and translation efficiency has become increasingly evident, underscoring the importance of understanding RNA structure. Chemical probing of RNA has emerged as a powerful technique for investigating RNA structure in living cells. This approach utilizes chemical probes that selectively react with accessible regions of RNA, and by measuring reactivity, the openness and potential of RNA for protein binding or base pairing can be inferred. Extensive experimental data generated using RNA chemical probing have significantly contributed to our understanding of RNA structure in cells. However, it is crucial to acknowledge potential biases in chemical probing data to ensure an accurate interpretation. In this study, we comprehensively analyzed transcriptome-scale RNA chemical probing data in eukaryotes and report common features. Notably, in all experiments, the number of bases modified in probing was small, the bases showing the top 10% reactivity well reflected the known secondary structure, bases with high reactivity were more likely to be exposed to solvent and low reactivity did not reflect solvent exposure, which is important information for the analysis of RNA chemical probing data.


Figures

Figure 1.
Figure 1.
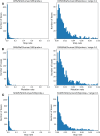
Histograms of the stop/mutation rate in RNA chemical probing experiments. The read data of RNA chemical probing experiments were mapped to 18S/25S/28S rRNA, and the reverse transcription stop and mutation rates were calculated. The horizontal axis represents the stop or mutation rate, while the vertical axis indicates the number of bases associated with the stop or mutation rate. The left-side panel displays a histogram in the range of 0–1.0, while the right-side panel is limited to the range of 0–0.1 for the same histogram. The mutation rate was calculated by dividing the number of specific bases with mutations by the total number of times that base was read. Similarly, the stop rate was calculated by dividing the number of specific bases at which reverse transcription was halted by the total number of times that base was read. (A) Data from human DMS stop profiles (8). (B) Data from human DMS mutation profiles (9). (C) Data from human SHAPE stop profiles (10). Histograms from other experiments are presented in Supplementary Figure S1.
Figure 2.
Figure 2.
Comparison of ROC curves with and without background subtraction in chemical probing experiments. (A) Human data from SHAPE/SEQ (10) were mapped to 18S rRNA. (B) Human data from SHAPE (2A3)/MaP (42) were mapped to 28S rRNA, and the ROC curves were plotted. When reactivity is high, it is considered positive, and when the dot–bracket data correspond to a dot, it is labeled as true. The "Plus - Background" represents the ROC curve calculated using background data for reactivity, while the "Plus only" represents the ROC curve calculated without background data for reactivity. For details on the reactivity calculation method, refer to the ‘Materials and methods’ section. Other data can be found in Supplementary Figure S2.
Figure 3.
Figure 3.
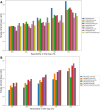
A comparison of whether to use background data to calculate the AUC of the reverse transcription stop profile. When mapping RNA chemical probing data to 18S rRNA and calculating reactivity, a comparison was made between using and not using background data. The "Plus only" represent the AUC value for reactivity calculated without background data, while the "Plus - Background" represent the AUC value when background data were incorporated. AUC was determined by using the secondary structure of 18S rRNA, considering bases with high reactivity as positive and base pairs as true, and then computing the ROC curve.
Figure 4.
Figure 4.
ROC curves generated from SHAPE/SEQ/human data (10) for IRESs. (A) Results for IRES ID hsa_ires_00184.1, Gene Symbol HIST1H1C from the IRESbase. (B) Results for IRES ID hsa_ires_00268.1, Gene Symbol HIST1H3H from the IRESbase. When reactivity is high, it is considered positive, and when the dot–bracket data correspond to a dot, it is labeled as true. The "Plus - Background" represents the ROC curve calculated using background data for reactivity, while the "Plus only" represents the ROC curve calculated without background data for reactivity. For details on the reactivity calculation method, refer to the ‘Materials and methods’ section. Other AUC data can be found in Table 3.
Figure 5.
Figure 5.
Accuracy of base pair identification by reactivity range. RNA chemical probing data were mapped to 18S/25S/28S rRNA, and the percentage of unpaired bases is shown for the top reactive bases. The horizontal axis shows the top x% of reactivity in the RNA molecule. The vertical axis shows the percentage of top x% reactive bases that are not involved in canonical base pairing. Panel (A) shows the results for 18S rRNA. Panel (B) shows the results for 25S/28S rRNA.
Figure 6.
Figure 6.
Relationship between solvent accessibility and reactivity. The horizontal axis shows the reactivity of mouse 18S rRNA from mouse cell SHAPE-seq data (10). The vertical axis shows the relative solvent accessibility calculated from the ribosome small subunit (PDB ID: 7CPU) of the mouse ribosomal structure. The panel (A) shows the relationship for the bases with the top 10% reactivity and the bases with the bottom 90% reactivity. The panel (B) shows that the relationship for the unpaired bases (not forming canonical base pairs) and the bases forming canonical base pairs. Since the reactivity distribution is peak at zero, the plots near zero overlap. Both Watson–Crick paired and unpaired plots are included in the region around zero. Refer to Supplementary Figure S1C for the distribution of reactivity of these data.

Similar articles

References

    1. Cech T.R., Steitz J.A. The noncoding RNA revolution—trashing old rules to forge new ones. Cell. 2014; 157:77–94. - PubMed
    1. Kruger K., Grabowski P.J., Zaug A.J., Sands J., Gottschling D.E., Cech T.R. Self-splicing RNA: autoexcision and autocyclization of the ribosomal RNA intervening sequence of Tetrahymena. Cell. 1982; 31:147–157. - PubMed
    1. Guerrier-Takada C., Gardiner K., Marsh T., Pace N., Altman S. The RNA moiety of ribonuclease P is the catalytic subunit of the enzyme. Cell. 1983; 35:849–857. - PubMed
    1. Metkar M., Pepin C.S., Moore M.J. Tailor made: the art of therapeutic mRNA design. Nat. Rev. Drug Discov. 2024; 23:67–83. - PubMed
    1. Strobel E.J., Yu A.M., Lucks J.B. High-throughput determination of RNA structures. Nat. Rev. Genet. 2018; 19:615–634. - PMC - PubMed

LinkOut - more resources