. 2024 Apr 8;3(1):e000328.
doi: 10.1136/bmjonc-2024-000328. eCollection 2024.

Characterisation of clinical response and transcriptional profiling of proliferating CD8 T cells in the blood of cancer patients after PD-1 monotherapy or combination therapy

Affiliations

Characterisation of clinical response and transcriptional profiling of proliferating CD8 T cells in the blood of cancer patients after PD-1 monotherapy or combination therapy

Rebecca C Obeng et al. BMJ Oncol. .

Abstract

Objective: Immune checkpoint inhibitors (ICI) that block the programmed cell death 1 (PD-1) pathway have shown promise with limited benefit. We and others have shown in small patient cohorts that an early proliferative CD8 T-cell response in the blood may be predictive of clinical response. However, these studies lack detailed analyses and comparisons between monotherapy and combination therapies.

Methods and analysis: We analysed longitudinal blood samples from 103 patients with cancer who received αPD-1 monotherapy or combined with anti-cytotoxic T lymphocyte-associated protein 4 (αCTLA-4) or chemotherapy. Transcriptional analysis of CD8 T cells after the first treatment cycle with effector cells generated following yellow fever virus (YFV-17D) vaccine-induced infection was also compared.

Results: An early proliferative (Ki-67+) CD8 T-cell response was observed after cycle 1 in 60 patients (58.3%). Patients with early-and-sustained proliferative responses (cycle 1 and beyond) had better clinical responses and survival than patients with an early-but-limited response (p=0.02). The proliferating cells had an effector-like phenotype. The transcriptional profiles of the effector-like CD8 T cells were similar irrespective of treatment type or clinical response but distinct from that of YFV-specific effector CD8 T cells.

Conclusions: Our data suggest that early proliferative CD8 T-cell response in the blood is predictive, and that an early-and-sustained proliferative response may further identify patients with prolonged survival. The ICI-induced effector-like CD8 T cells are transcriptionally distinct from highly functional YFV-specific cells, suggesting opportunities for improved T-cell effector function with combination therapies for better clinical outcome.

Keywords: Biomarkers; Immunotherapy; T-lymphocytes.


Conflict of interest statement

Competing interests: RA has patents related to the PD-1 inhibitory pathway.

Figures

Figure 1
Figure 1
Peripheral CD8 T-cell response and phenotype after PD-1-targeted therapy. (A) Schematic diagram of treatment, blood collection, and T-cell analysis from patients. (B) Gating strategy for CD8 T-cell analysis by flow cytometry. (C) Representative dot plots of the proportion of Ki67+ of CD8 T cells before and after cycle 1 (post C1). (D) Fold change of Ki67+ CD8 T cells before and after treatment cycles. Shaded area in the graphs indicates the 1.5-fold cut-off for an early proliferative response. (E) Summary plot of the percent Ki67+ CD8 T cells before and after cycle 1. (F) Representative dot plots from two patients showing pretreatment and post-C1 proportion of Ki67 and PD-1 expression in CD8 T cells. (G) Fold change in Ki67+ CD8 T cells in PD-1neg and PD-1+ subsets for each patient after the first cycle of treatment. (H–J) Representative contour plots and summary graphs of CD38 and HLA-DR (H) CD45RA and CCR7 (I) and PD-1 (J) expression on Ki67+ CD8 T cells (red) in comparison with naïve CD8 T cells (black). (K–M) Representative contour plots and summary graphs for granzyme B (K) co-stimulatory molecules (CD28 (L) and inhibitory molecule TIM-3 (M) expression on PD-1+Ki67+ CD8 (red) and naïve (black) cells after C1. Bar graphs/horizontal lines and error bars represent mean and SD, respectively. P values represent Wilcoxon tests. PD-1, programmed cell death 1.
Figure 2
Figure 2
Association of early proliferative response with clinical response and overall survival. (A) Waterfall plots showing change in tumour size at the time of follow-up imaging (6–12 weeks) from baseline for all patients. Patients who received monotherapy are indicated with closed bars and those who received PD-/chemo or PD-1/CTLA-4 are indicated with open bars. (B–D). Overall survival of all patients (B) patients who received monotherapy (C) and those who received combination therapy (B) based on clinical response. OR (objective response), SD (stable disease), PD (progressive disease). P values of log-rank test. (E) Spider plot showing fold change of Ki67+ CD8 T cells after each cycle of treatment for early proliferative responders and delayed/no responders. (F) Proportion of patients with early or delayed/no proliferative response who had OR, SD, or PD (p value of χ2 test). (G–H) Spider plots showing fold change of Ki67+ CD8 T cells after each treatment cycle in patients who received monotherapy (G) or combination therapy (H). Shaded area in the graphs (E, G, H) indicates the 1.5-fold cut-off for early proliferative responses. PD-1, programmed cell death 1.
Figure 3
Figure 3
Association between sustained proliferative response and clinical response and overall survival. (A) Clinical response of patients who had sustained vs unsustained or no proliferative response; p value of χ2 test. (B) Fold change in Ki67+ CD8 T cells from patients with early-and-sustained proliferative responses and patients with early-but-limited proliferative responses. Shaded area represents 1.5-fold cut-off for early proliferative responses. (C) Proportion of patients with early-and-sustained proliferative responses and those with early-but-limited responses among patients who received PD-1-targeted monotherapy, PD-1/chemo, or PD-1/CTLA-4. P value is of Fisher’s exact test. (D) Overall survival of early-and-sustained proliferative responders and early-but-limited proliferative responders. P value of log-rank test. OR, objective response; PD, progressive disease; PD-1, programmed cell death 1; SD, stable disease.
Figure 4
Figure 4
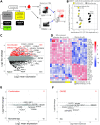
Transcriptional profile of ICI-induced effector-like CD8 T cells from the peripheral blood of patients with cancer. (A) Patient samples and sorting strategy for ICI-induced effector-like (HLA-DR+CD38+) and naïve (CD45RA+CCR7+) CD8 T cells from early proliferative responders for bulk RNA sequencing (after cycle 1). (B) Principal component analysis of the naïve and ICI-induced effector-like CD8 T cells. (C) MA plot displaying the log2 fold-change compared with log2 mean expression generated using a DESeq2 data set, with default log2 fold-change thresholds of −2 and 2 for naive CD8 T cells versus ICI-induced CD8 T cells. (D) Heat-map of relative expression of selected immune-related genes in naïve and ICI-induced effector-like CD8 T cells from the peripheral blood of early proliferative responders. Scales of color represent Z-scores. (E–F) MA plot displaying the log2 fold-change compared with log2 mean expression for combination therapy versus monotherapy (E) and PD versus OR/SD responses (F). ICI, immune checkpoint inhibitors; Ipi,ipilimumab; Nivo, nivolumab; OR, objective response; PD, progressive disease; SD, stable disease.
Figure 5
Figure 5
Comparison of transcriptional profiles between ICI-induced effector-like CD8 T cells and effector and memory CD8 T cells derived from YFV. (A–B) Schematic diagram of the isolation and sorting of effector and memory YFV-specific CD8 T cells (sorted by tetramer) after vaccination. (C) Principal component analysis of ICI-induced effector-like CD8 T cells from early proliferative responders, effector and memory YFV-specific cells, and naïve CD8 T cells from patients with cancer and YFV. Gene expression in the ICI-induced effector-like and effector and memory YFV-specific CD8 T cells were normalised to the average of expression of naïve samples from the corresponding counterpart. (D) Venn diagram depicting the number of shared and differentially expressed genes expressed in ICI-induced effector-like CD8 T cells, effector YFV-specific and memory YFV-specific cells. Circle size represents negative log p value. (E) Gene Set Enrichment Analysis of the ICI-induced effector-like CD8 T cells from early proliferative responders and effector YFV-specific cells. NES - normalized enrichment score. (F) Heat-map of selected immune-related genes showing relative expression between naïve, ICI-induced effector-like, effector YFV-specific and memory YFV-specific cells. Scales of color represent Z-scores. ICI, immune checkpoint inhibitors; IL, interleukin; YFV, yellow fever virus.

References

    1. Barber DL, Wherry EJ, Masopust D, et al. . Restoring function in exhausted Cd8 T cells during chronic viral infection. Nature 2006;439:682–7. 10.1038/nature04444 - DOI - PubMed
    1. Herbst RS, Soria J-C, Kowanetz M, et al. . Predictive correlates of response to the anti-PD-L1 antibody Mpdl3280A in cancer patients. Nature 2014;515:563–7. 10.1038/nature14011 - DOI - PMC - PubMed
    1. Hodi FS, O’Day SJ, McDermott DF, et al. . Improved survival with Ipilimumab in patients with metastatic Melanoma. N Engl J Med 2010;363:711–23. 10.1056/NEJMoa1003466 - DOI - PMC - PubMed
    1. Leach DR, Krummel MF, Allison JP. Enhancement of antitumor immunity by CTLA-4 blockade. Science 1996;271:1734–6. 10.1126/science.271.5256.1734 - DOI - PubMed
    1. Powles T, Eder JP, Fine GD, et al. . Mpdl3280A (anti-PD-L1) treatment leads to clinical activity in metastatic bladder cancer. Nature 2014;515:558–62. 10.1038/nature13904 - DOI - PubMed

LinkOut - more resources