. 2025 Jan 29;17(1):e70048.
doi: 10.1002/dad2.70048. eCollection 2025 Jan-Mar.

Age-disproportionate atrophy in Alzheimer's disease and Parkinson's disease spectra

Affiliations

Age-disproportionate atrophy in Alzheimer's disease and Parkinson's disease spectra

Kenji Yoshinaga et al. Alzheimers Dement (Amst). .

Abstract

Introduction: Brain age gap (BAG), defined as the difference between MRI-predicted 'brain age' and chronological age, can capture information underlying various neurological disorders. We investigated the pathophysiological significance of the BAG across neurodegenerative disorders.

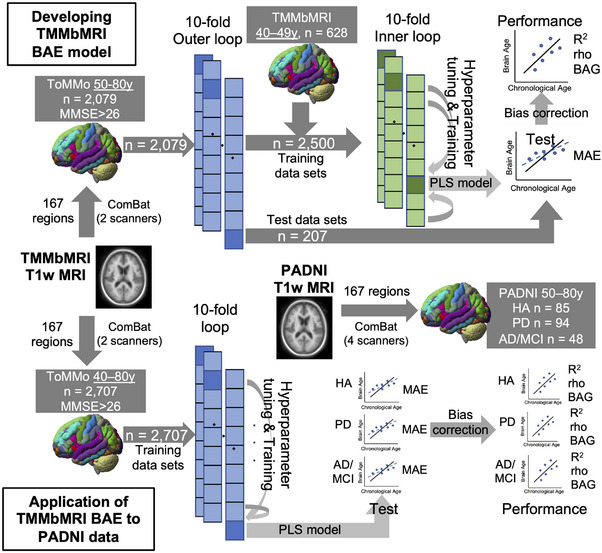
Methods: We developed a brain age estimator using structural MRIs of healthy-aged individuals from one cohort study. Subsequently, we applied this estimator to people with Alzheimer's disease spectra (AD) and Parkinson's disease (PD) from another cohort study. We investigated brain sources responsible for BAGs among these groups.

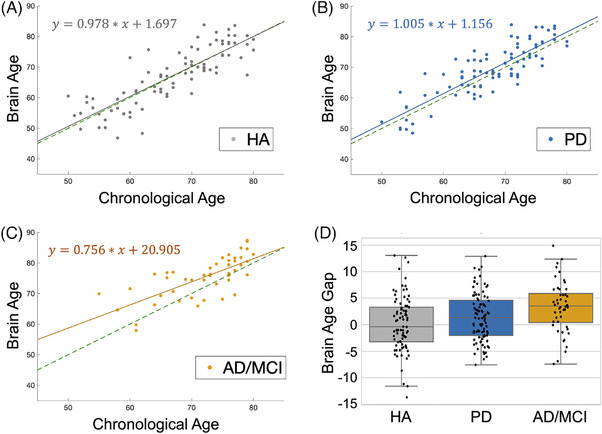
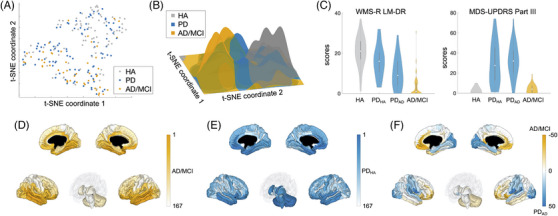
Results: Both AD and PD exhibited a positive BAG. Brain sources showed overlapping, yet partially segregated, neuromorphological differences between these groups. Furthermore, employing with t-distributed stochastic neighbor embedding on the brain sources, we subclassified PD into two groups with and without cognitive impairment.

Discussion: Our findings suggest that brain age estimation becomes a clinically relevant method for finely stratifying neurodegenerative disorders.

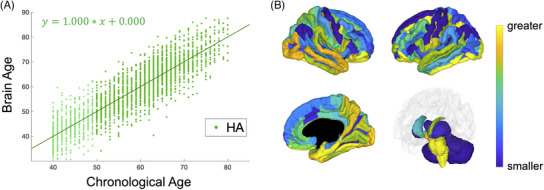
Highlights: Brain age estimated from structure MRI data was greater than chronological age in patients with Alzheimer's disease/mild cognitive impairment or Parkinson's disease.Brain regions attributed to brain age estimation were located mainly in the fronto-temporo-parietal cortices but not in the motor cortex or subcortical regions.Brain sources responsible for the brain age gaps revealed roughly overlapping, yet partially segregated, neuromorphological differences between participants with Alzheimer's disease/mild cognitive impairment and Parkinson's disease.Participants with Parkinson's disease were subclassified into two groups (with and without cognitive impairment) based on brain sources responsible for the brain age gaps.

Keywords: MRI; cognitive impairment; cohort; imaging markers; machine learning.


Conflict of interest statement

The authors declare no conflicts of interest. Author disclosures are available in the Supporting Information.

Figures

FIGURE 1
FIGURE 1
Analysis pipelines and validation schemes of brain age estimation (BAE) (upper panels). The brain age estimation (BAE) model was constructed using a partial least square regression (PLS) with a nested 10‐fold cross‐validation (CV). We used 167 features (cortical thickness and subcortical volumes) extracted from T1‐weighted (T1w) magnetic resonance imaging scans (MRIs) of cognitively unimpaired (Mini‐Mental State Examination [MMSE] score > 26), community‐dwelling individuals in the Tohoku Medical Megabank Brain MRI (TMMbMRI) study. We used MRIs from individuals older than 40 years for hyperparameter tuning and training and applied the trained BAE to people aged ≥50 years for performance testing with mean absolute error (MAE) and R 2, rho, and brain age gap (BAG) (lower panels). The TMMbMRI BAE was applied to the Parkinson's and Alzheimer's disease Dimensional Neuroimaging Initiative (PADNI) individuals (aged ≥ 50 years), including healthy older adults (HA), Alzheimer's disease (AD), mild cognitive impairment (MCI), and Parkinson's disease (PD), collected from four sites after ComBat harmonization. Note that MCI and AD were combined and treated as a single group (AD/MCI) due to the small number of participants
FIGURE 2
FIGURE 2
Brain age estimation (BAE) based on 2707 community‐dwelling people in the Tohoku Medical Megabank Brain MRI (TMMbMRI) study. (A) A plot of the brain age against the chronological age. Each dot represents an individual. The green line represents a regression line. The participants aged 40–50 years are represented in light green. (B) Weighted sum of the partial least squares regression components of our BAE model, back‐projected onto brain regions (BAE source map). Yellow‐ and blue‐colored regions have a higher and lower contribution to BAE, respectively
FIGURE 3
FIGURE 3
Application of the brain age estimation (BAE) model of the Tohoku Medical Megabank Brain MRI (TMMbMRI) data to the dataset of the Parkinson's and Alzheimer's disease Dimensional Neuroimaging Initiative (PADNI) cohort. Plots of the brain age against the chronological age in (A) healthy older adults (HA), (B) Parkinson's disease (PD), and (C) Alzheimer's disease/mild cognitive impairment (AD/MCI). The green dotted lines are the regression lines estimated by the TMMbMRI BAE. Solid lines are regression lines estimated by each group's data. (D) Boxplots of the brain age gaps were computed from each group's data. Boxes represent the interquartile range of the 25th and 75th percentile. Whiskers represent 1.5 times of the interquartile range. Each dot represents each person (A–D).
FIGURE 4
FIGURE 4
The t‐distributed stochastic neighbor embedding (t‐SNE) analysis and difference of contribution of the cortical thickness and subcortical volume. (A) 2D t‐SNE plot of the brain age gap (BAG) source data in the Parkinson's and Alzheimer's disease Dimensional Neuroimaging Initiative (PADNI) healthy older adults (HA), Parkinson's disease (PD), and Alzheimer's disease/mild cognitive impairment (AD/MCI). (B) Probability density distribution of the AD/MCI, PD, and HA data. The probability density distribution was estimated from the 2D t‐SNE plot in (A) using the kernel density estimation method. (C) Violin plots of scores of the delayed recall of logical memory in Wechsler Memory Scale‐Revised (WMS‐R LM‐DR) and International Parkinson and Movement Disorder Society (MDS) ‐sponsored revision of Unified Parkinson's Disease Rating Scale, Part III (MDS‐UPDRS Part III) in HA, PD classified as HA (PDHA), PD classified as AD/MCI (PDHA), and AD/MCI. (D) Ranks of BAG sources of the AD/MCI projected back onto each brain region (BAG attribution map). Small numbers represent more severe involvement. (E) BAG attribution map of PDHA. (F) Across‐group BAG attribution map for AD/MCI and PDAD (AD—PDAD). Orange color represents more severe involvement in AD/MCI while blue color in PDAD.

Similar articles

Cited by

References

    1. Bethlehem RaI, Seidlitz J, White SR, et al. Brain charts for the human lifespan. Nature. 2022;604(7906):525‐533. doi:10.1038/s41586-022-04554-y - DOI - PMC - PubMed
    1. Sudlow C, Gallacher J, Allen N, et al. UK Biobank: an open access resource for identifying the causes of a wide range of complex diseases of middle and old age. PLoS Med. 2015;12(3):e1001779. doi:10.1371/journal.pmed.1001779 - DOI - PMC - PubMed
    1. Caspers S, Moebus S, Lux S, et al. Studying variability in human brain aging in a population‐based German cohort – rationale and design of 1000BRAINS. Front Aging Neurosci. 2014;6:149. doi:10.3389/fnagi.2014.00149 - DOI - PMC - PubMed
    1. Cole JH, Franke K. Predicting age using neuroimaging: innovative brain ageing biomarkers. Trends Neurosci. 2017;40(12):681‐690. doi:10.1016/j.tins.2017.10.001 - DOI - PubMed
    1. Franke K, Gaser C. Ten years of BrainAGE as a neuroimaging biomarker of brain aging: what insights have we gained? Front Neurol. 2019;10:789. doi:10.3389/fneur.2019.00789 - DOI - PMC - PubMed

LinkOut - more resources