. 2025 Jan 27;15(4):1399-1419.
doi: 10.7150/thno.97254. eCollection 2025.

P2X7R antagonism suppresses long-lasting brain hyperexcitability following traumatic brain injury in mice

Affiliations

P2X7R antagonism suppresses long-lasting brain hyperexcitability following traumatic brain injury in mice

Mariana Alves et al. Theranostics. .

Abstract

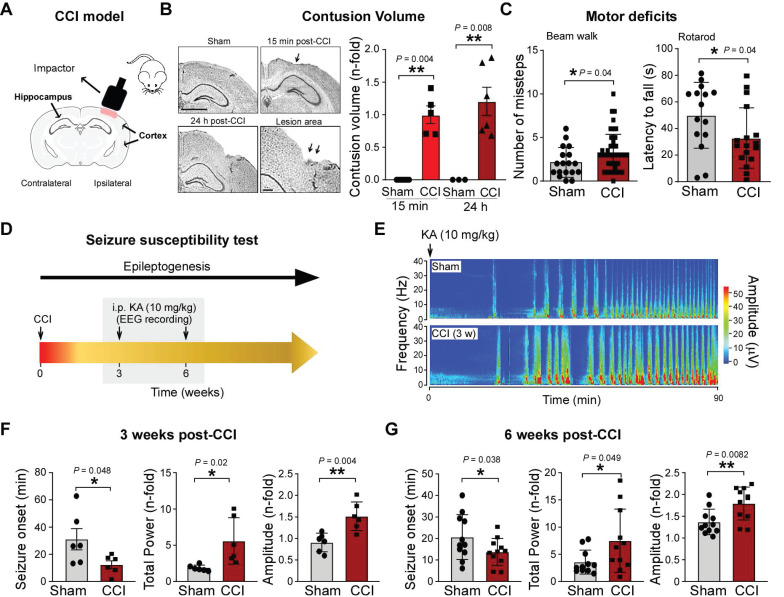
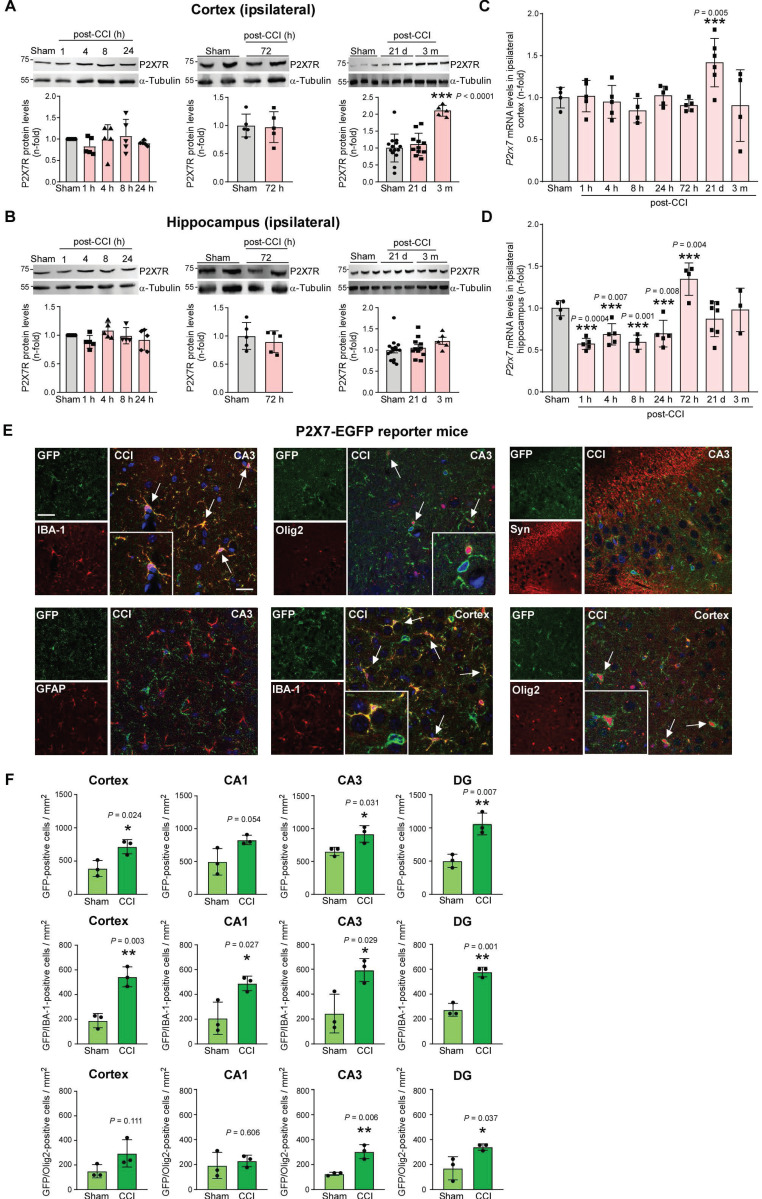
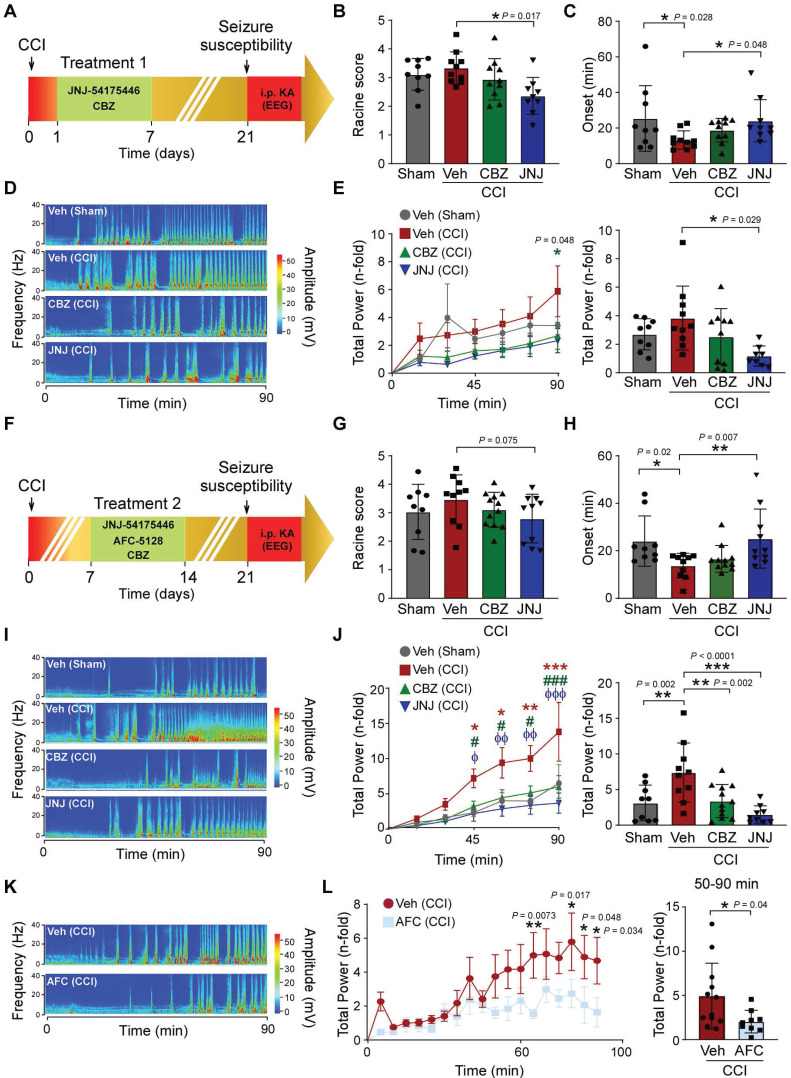
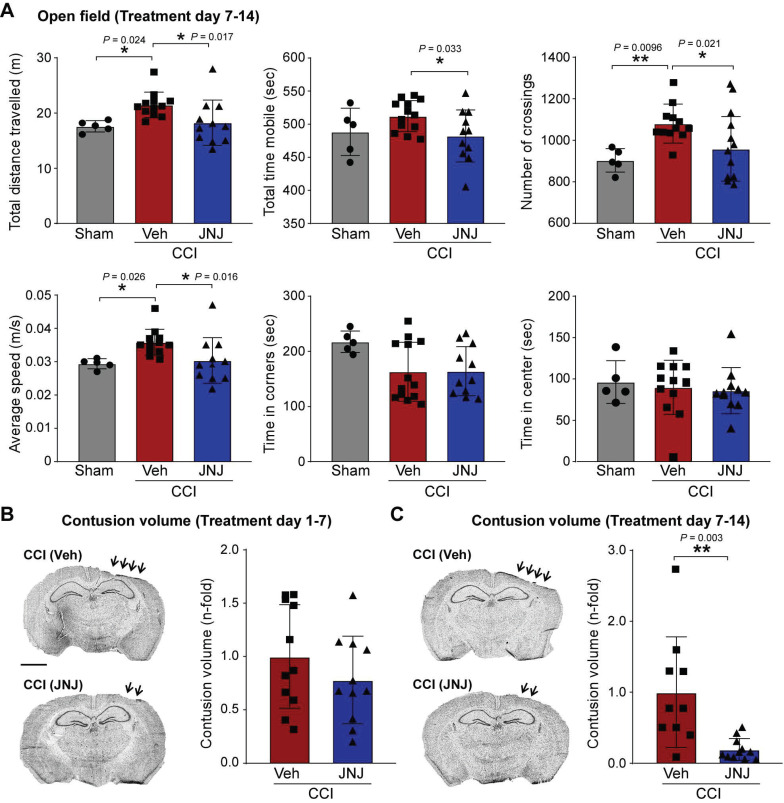
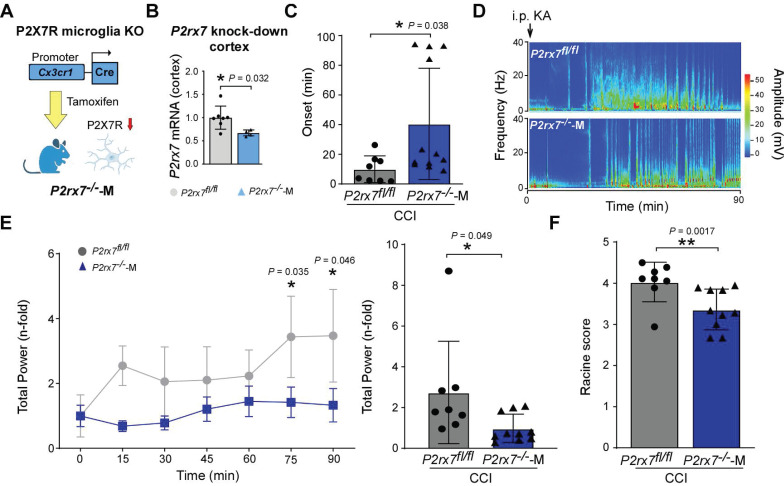
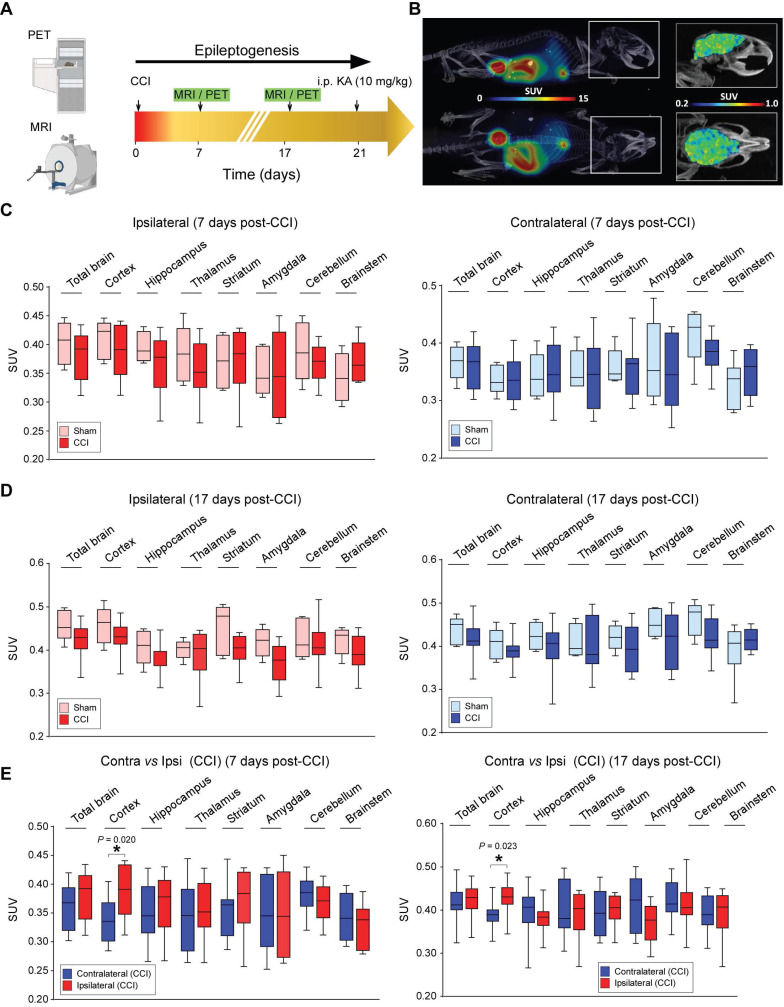
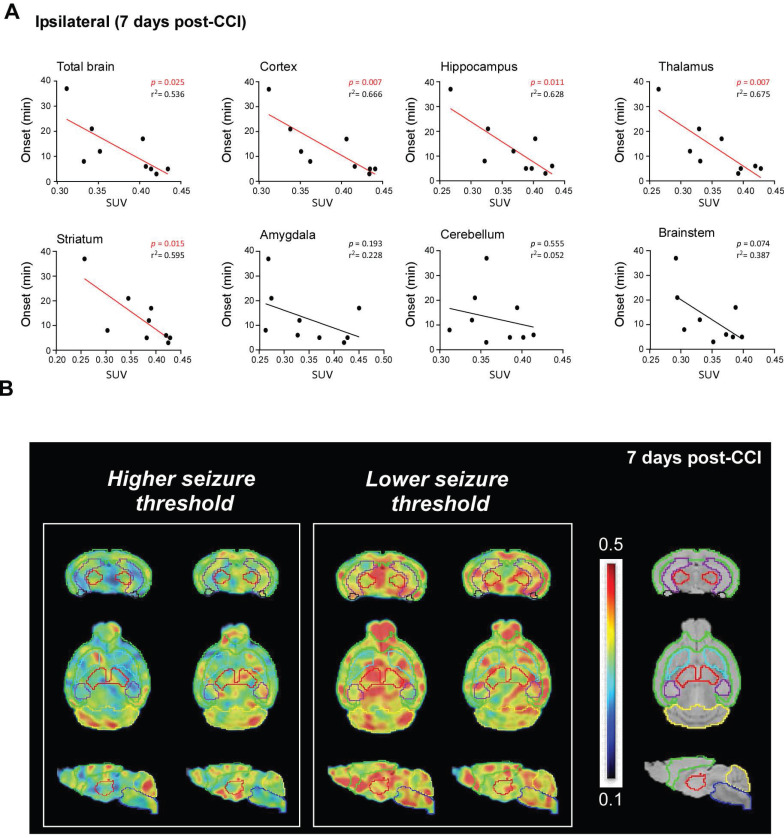
Purpose: Post-traumatic epilepsy (PTE) is one of the most common life-quality reducing consequences of traumatic brain injury (TBI). However, to date there are no pharmacological approaches to predict or to prevent the development of PTE. The P2X7 receptor (P2X7R) is a cationic ATP-dependent membrane channel that is expressed throughout the brain. While increasing evidence suggests a role for the P2X7R during seizures and epilepsy, it is unclear if changes in P2X7R expression can predict TBI-induced epilepsy development, and whether P2X7R antagonism can protect against long-lasting brain hyperexcitability caused by TBI. Methods: TBI was induced in adult male mice using the controlled cortical impact model (CCI). To test the anti-epileptogenic effects of P2X7R antagonism, mice were treated with brain-penetrant P2X7R antagonists JNJ-54175446 (30 mg/kg) or AFC-5128 (30 mg/kg) for 7 days post-CCI. The cell-type specific effects of P2X7Rs on TBI-induced hyperexcitability were analyzed in mice lacking exon 2 of the P2rx7 gene selectively in microglia (P2rx7:Cx3cr1-Cre). Static positron emission tomography (PET) via an intravenous injection of the P2X7R radioligand 18F-JNJ-64413739 and magnetic resonance imaging (MRI) were conducted twice during the first- and third-week post-injury. Results: Following TBI, while there were no obvious changes in P2X7R protein levels in the ipsilateral hippocampus post-injury, there was a delayed increase in P2X7R protein levels in the ipsilateral cortex at 3 months post-injury. Treatment with P2X7R antagonists shortly after TBI reduced long-lasting brain hyperexcitability, reduced cortical contusion volume, and normalized injury-induced hyperactivity to control sham-levels at 3 weeks post-TBI. Notably, mice lacking P2rx7 in microglia had an increased seizure threshold after TBI, suggesting that P2X7R contributed to brain hyperexcitability via its effects on microglia. Finally, P2X7R radioligand uptake after TBI correlated with seizure threshold at 3 weeks post-injury. Conclusions: Our results demonstrate the antiepileptogenic potential of P2X7R antagonism to prevent TBI-induced epilepsy and indicate that P2X7R-based PET imaging may be a useful diagnostic tool to identify people at risk of developing PTE.

Keywords: Epileptogenesis; Magnetic Resonance Imaging; Microglia; P2X7 Receptor; Positron Emission Tomography; Post-traumatic Epilepsy; Traumatic Brain Injury.


Conflict of interest statement

Competing interests: The authors declare no conflict of interest. The funders had no role in the design of the study; in the collection, analyses or interpretation of data; in the writing of the manuscript; or in the decision to publish the results. The authors declare that this study received funding from FutureNeuro. Bert Klebl, Klaus Dinkel and Michael Hamacher are stakeholders in KHAN Technology, Affectis Pharmaceuticals and Lead Discovery Center GmbH respectively but had no influence in the study design. Anindya Bhattacharya, James Palmer, and Marc Ceusters are/were employees of Janssen Research and Development.

Figures

Figure 1
Figure 1
CCI leads to long-lasting brain hyperexcitability. (A) Schematic showing the CCI model in mice. (B) Representative images and graphs showing contusion volume in the ipsilateral cortex 15 min and 24 h post-CCI (n = 7 (sham-15min), 3 (sham-24h), 5 (15 min post-CCI) and 6 (24 h post-CCI)). (C) Foot faults assessed by the Beam walk (n = 18 (sham) and 63 (CCI)) and latency to fall using the Rotarod (n = 15 (sham) and 17 (CCI)) 24 h post-CCI. Unpaired Student's t-test. (D) Experimental approach to test for long-lasting brain hyperexcitability post-CCI. Mice were administered KA (10 mg/kg, i.p.) 3 and 6 weeks post-CCI and EEG was recorded for 90 min post-KA injection. (E) Representative EEG recording represented via heat map from mice (sham- and CCI) administered i.p. KA 3 weeks post-injury. (F) Graphs showing seizure onset, total power and amplitude of EEG recording from mice administered i.p. KA 3 weeks post-CCI (n = 6 per group). Unpaired Student's t-test. (G) Graphs showing EEG total power and amplitude of mice (sham- and CCI) administered i.p. KA 6 weeks post-CCI (n = 11 per group). Unpaired Student's t-test. Data are shown as mean ± SD. Created with BioRender.com. *P < 0.05; **P < 0.01.
Figure 2
Figure 2
P2X7R expression post-CCI in the ipsilateral cortex and hippocampus. Representative Western blots and graphs showing P2X7R protein levels (Synaptic Systems Antibody) in ipsilateral cortical (A) and hippocampal (B) tissue at different timepoints post-CCI (cortex and hippocampus (n = 5 (24 h and 72 h sham), 5 (post-CCI: 1 h, 4 h, 8 h, 24 h, 72 h), 15 (sham: 21 days and 3 months) and 16 (post-CCI: 21 days and 3 months). One-way ANOVA followed by Fischer's multiple-comparison test. (C, D) P2rx7 transcript levels at different time-points post-CCI in the ipsilateral cortex and hippocampus (Cortex: n = 4 (24 h sham), 5 (post-CCI: 1 h, 4 h, 24 h, 72 h), 4 (post-CCI: 8 h and 3 months) and 6 (post-CCI: 21 days); Hippocampus: n = 4 (24 h sham), 5 (post-CCI: 1 h, 4 h, 24 h), 4 (post-CCI: 8 h and 72 h), 7 (post-CCI: 21 days) and 3 (post-CCI: 3 months)). One-way ANOVA followed by Fischer's multiple-comparison test, CCI vs sham mice. (E) Representative images showing co-expression of GFP (green) with IBA-1 (red) and Olig2 (red) 21 days post-CCI in the cortex and the hippocampal subfield CA3. No co-expression was observed between GFP (green) and GFAP (red) and synaptophysin (red) at the same time-point post-CCI in CA3. DAPI is shown in blue. Scale bar = 100 µm (small images, left) and 20 µm (merge image, right). (F) Quantification of GFP-positive cells in the cortex and all three hippocampal subfields (CA1, CA3 and DG) in P2X7-EGFP reporter mice 3 weeks post-CCI (or sham) and GFP-positive cells co-expressed with the microglia marker IBA-1 and oligodendrocyte marker Olig2 (n = 3 per group). Unpaired Student's t-test. Data are shown as mean ± SD. *P < 0.05; **P < 0.01; ***P < 0.001.
Figure 3
Figure 3
P2X7R antagonism reduces long-lasting brain hyperexcitability post-CCI. (A) Schematic showing experimental approach. Sham- and CCI mice were treated with the P2X7R antagonist JNJ-54175446 (30 mg/kg), carbamazepine (CBZ, 40 mg/kg) or vehicle for 7 days starting from day 1 - 7 post-sham/CCI (treatment window 1). All mice were then subjected to i.p. KA (10 mg/kg) 21 days post-sham/CCI and cortical EEG was recorded for 90 min. (B) Graph showing behaviour changes according to a modified Racine scale during a 90 min recording period starting from i.p. KA injection in mice treated with JNJ or vehicle (treatment window 1) (n = 9 (sham-vehicle), 10 (CCI-vehicle), 10 (CCI-CBZ) and 9 (CCI-JNJ)). One-way ANOVA followed by Fischer's multiple-comparison test. (C) Graph showing time to first electrographic seizure following i.p. KA (n = 9 (sham-vehicle), 10 (CCI-vehicle), 10 (CCI-CBZ) and 9 (CCI-JNJ)). One-way ANOVA followed by Fischer's multiple-comparison test. (D) Representative heat map and (E) graphs showing EEG total power over 90 min EEG recording period starting from time of i.p. KA administration in mice treated with JNJ or vehicle (treatment window 1) (left: EEG analysis of 15 min segments; right: EEG analysis of complete 90 min) (n = 9 (sham-vehicle), 10 (CCI-vehicle), 10 (CCI-CBZ) and 8 (CCI-JNJ)). One-way ANOVA followed by Fischer's multiple-comparison test. (F) Schematic delineating treatment window 2. Mice were treated with JNJ (30 mg/kg), AFC-5128 (30 mg/kg) or CBZ (40 mg/kg) from day 7 - 13 post-sham/CCI and administered i.p. KA at day 21 post-sham/CCI. (G) Graph showing behaviour changes according to a modified Racine scale during a 90 min recording period starting from time of i.p. KA injection in mice treated with JNJ, CBZ or vehicle (treatment window 2) (n = 9 (sham-vehicle), 10 (CCI-vehicle), 12 (CCI-CZB) and 10 (CCI-JNJ)). One-way ANOVA followed by Fischer's multiple-comparison test. (H) Graph showing time to first electrographic seizure following i.p. KA (n = 9 (sham-vehicle), 10 (CCI-vehicle), 12 (CCI-CBZ) and 10 (CCI-JNJ)). One-way ANOVA followed by Fischer's multiple-comparison test. (I) Representative heat maps and (J) graphs showing EEG total power over 90 min EEG recording period starting from time of i.p. KA administration in mice treated with JNJ, CBZ or vehicle (Veh) (treatment window 2) (left: EEG analysis of 15 min segments; right: EEG analysis of complete 90 min). Left graph: sham vs CCI Veh: *P = 0.02 (45 min), *P = 0.01 (60 min), **P = 0.004 (75 min), ***P = 0.0005 (90 min); CCI Veh vs CCI CZB: #P = 0.04 (45 min), #P = 0.01 (60 min), #P = 0.01 (75 min), ###P < 0.0001 (90 min); CCI Veh vs CCI-JNJ: ϕP = 0.01 (45 min), ϕϕP = 0.001 (60 min), ϕϕP = 0.001 (75 min), ϕϕϕP < 0.0001 (90 min) (n = 9 (sham-vehicle), 10 (CCI-vehicle), 12 (CCI-CBZ) and 10 (CCI-JNJ)). (K) Representative heat map and (L) graphs showing EEG total power over 90 min EEG recording period starting from time of i.p. KA administration in mice subjected to CCI treated with AFC-5128 (AFC) or vehicle (treatment window 2) (n = 12 (CCI-vehicle), 9 (CCI-AFC)). Unpaired Student's t-test. We used the ROUT test (Q = 0.1%) to detect outliers in our data set. One outlier was detected and removed from Figure 3E in the JNJ-treated group. Data are presented as mean ± SD, except for Figure 3E, 3J, and 3L, where the left graph displays total power over time as mean ± SEM. *P < 0.05; **P < 0.01; ***P < 0.001.
Figure 4
Figure 4
P2X7R antagonism protects against CCI-induced tissue loss and hyperactivity. (A) Open field analysis of mice subjected to sham and CCI treated with vehicle or P2X7R antagonist JNJ-54175446 (JNJ) during treatment window 2. Open field was carried out at day 21 post-CCI/sham. Parameters analyzed include total distance travelled, total time mobile, number of crossings, average speed, time in corners and time in center (n = 5 (sham-vehicle), 13 (CCI-vehicle) and 11 (CCI-JNJ)). One-way ANOVA followed by Fischer's multiple-comparison test. (B-C) Representative images and graphs showing ipsilateral cortical contusion volume in mice subjected to CCI and treated with the P2X7R antagonist JNJ-54175446 (JNJ) during treatment window 1 (B) (n = 11 (CCI-vehicle) and 11 (CCI-JNJ)) and treatment window 2 (C) (n = 10 (CCI-vehicle) and 11 (CCI-JNJ)). Scale bar = 1 mm. Unpaired Student's t-test. Data are shown as mean ± SD. *P < 0.05; **P < 0.01.
Figure 5
Figure 5
P2X7R-mediated effects on microglia contribute to long-lasting brain hyperexcitability post-CCI. (A) Schematic showing conditional cell type-specific knockdown of P2X7R in microglia (P2rx7-/--M) using a tamoxifen-inducible Cre (Cx3cr1) line. (B) Cortical P2rx7 mRNA levels post-tamoxifen treatment in naïve conditions (n = 7 (P2rx7fl/fl) and 4 (P2rx7-/--M)). Unpaired Student's t-test. (C) Graphs showing seizure onset of P2rx7fl/fl and P2rx7-/--M mice 21 days post-CCI subjected to i.p. KA (n = 8 (P2rx7fl/fl) and 10 (P2rx7-/--M)). Unpaired Student's t-test. (D) Representative heat map of P2rx7fl/fl and P2rx7-/--M mice 21 days post-CCI subjected to i.p. KA. (E) Graphs showing EEG total power during a 90 min recording period from the time of i.p. KA of P2rx7fl/fl and P2rx7-/--M mice 21 days post-CCI (n = 8 (P2rx7fl/fl) and 10 (P2rx7-/--M)) (left: EEG analysis of 15 min segments; right: EEG analysis of complete 90 min). Left graph: Two-way ANOVA. Right graph: Unpaired Student's t-test. (F) Graph showing behaviour changes according to a modified Racine scale during a 90 min recording period starting from i.p. KA injection in P2rx7fl/fl and P2rx7-/--M mice 21 days post-CCI (n = 8 (P2rx7fl/fl) and 10 (P2rx7-/--M)). Unpaired Student's t-test. Data are shown as mean ± SD. Created with BioRender.com. *P < 0.05; **P < 0.01.
Figure 6
Figure 6
P2X7R PET imaging following CCI. (A) Schematic showing experimental approach. Mice were subjected to sham/CCI and MRI and PET imaging were carried out at the beginning of the 2nd week post-CCI and during the 3rd week post-CCI/sham. Mice where then administered KA (10 mg/kg, i.p.) and EEG recorded for 90 min. (B) Illustrative whole-body (left) and brain (right) PET-CT images (top: sagittal, bottom: axial) of a sham mouse used in the study. Colour scales in Standardized Uptake Values (SUV). (C, D) Graphs showing P2X7R radioligand uptake in ipsilateral and contralateral brain hemispheres 7 days post-sham and CCI (n = 5 (sham) and 10 (CCI), One-way ANOVA followed by Fischer's multiple-comparison test (C)) and 17 days post-CCI (n = 5 (sham) and 10 (CCI), One-way ANOVA followed by Fischer's multiple-comparison test (D)). (E) Graphs showing difference in P2X7R radioligand uptake between ipsi- and contralateral brain areas 7 days and 17 days post-CCI (n = 5 (sham) and 10 (CCI)). One-way ANOVA followed by Fischer's multiple-comparison test. Data are shown as mean ± SEM. Created with BioRender.com. *P < 0.05
Figure 7
Figure 7
P2X7R radioligand uptake and correlation with seizure threshold 7 days post-CCI. (A) Graphs showing correlation between seizure onset after i.p. KA treatment (21 days post-CCI) and P2X7R radioligand uptake in different ipsilateral brain structures 7 days post-CCI (n = 9). Spearman's correlation coefficient. (B) Representative brain PET images (from top to bottom: coronal, axial and sagittal) of mice with a high and low seizure threshold determined via latency to first seizure post-i.p. KA treatment. The MirroneT2 MRI template is denoted on the right for regional reference (green: cortex, red: thalamus, light blue: striatum, purple: hippocampus, black: amygdala, dark blue: brain stem, yellow: cerebellum).

References

    1. Dewan MC, Rattani A, Gupta S, Baticulon RE, Hung YC, Punchak M. et al. Estimating the global incidence of traumatic brain injury. J Neurosurg. 2018;130:1080–97. - PubMed
    1. Agrawal A, Timothy J, Pandit L, Manju M. Post-traumatic epilepsy: an overview. Clin Neurol Neurosurg. 2006;108:433–9. - PubMed
    1. Ferguson PL, Smith GM, Wannamaker BB, Thurman DJ, Pickelsimer EE, Selassie AW. A population-based study of risk of epilepsy after hospitalization for traumatic brain injury. Epilepsia. 2010;51:891–8. - PubMed
    1. Bramlett HM, Dietrich WD. Long-Term Consequences of Traumatic Brain Injury: Current Status of Potential Mechanisms of Injury and Neurological Outcomes. J Neurotrauma. 2015;32:1834–48. - PMC - PubMed
    1. Bialer M, White HS. Key factors in the discovery and development of new antiepileptic drugs. Nat Rev Drug Discov. 2010;9:68–82. - PubMed

Publication types

MeSH terms

Substances