. 2025 Jan 30;47(1):fbae079.
doi: 10.1093/plankt/fbae079. eCollection 2025 Jan-Feb.

Spatio-temporal variability of mesozooplankton distribution along the Canary Current Large Marine Ecosystem: a regional perspective

Affiliations

Spatio-temporal variability of mesozooplankton distribution along the Canary Current Large Marine Ecosystem: a regional perspective

Yassine Goliat et al. J Plankton Res. .

Abstract

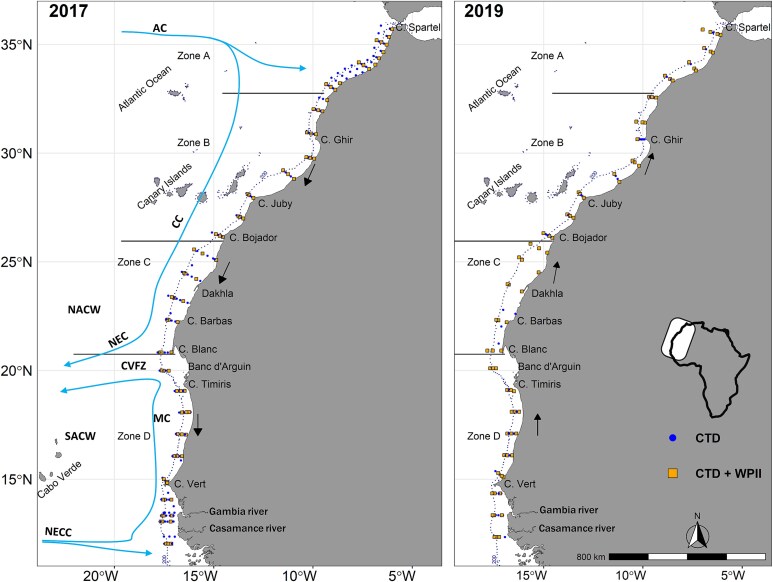
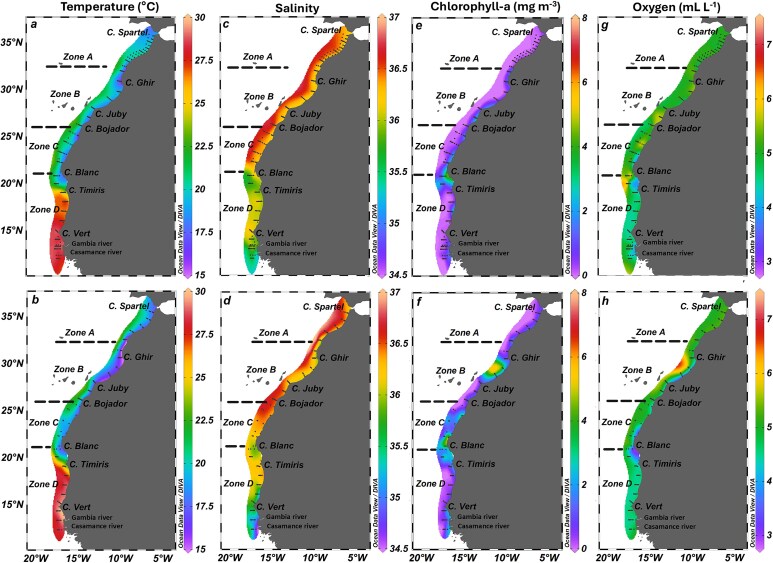
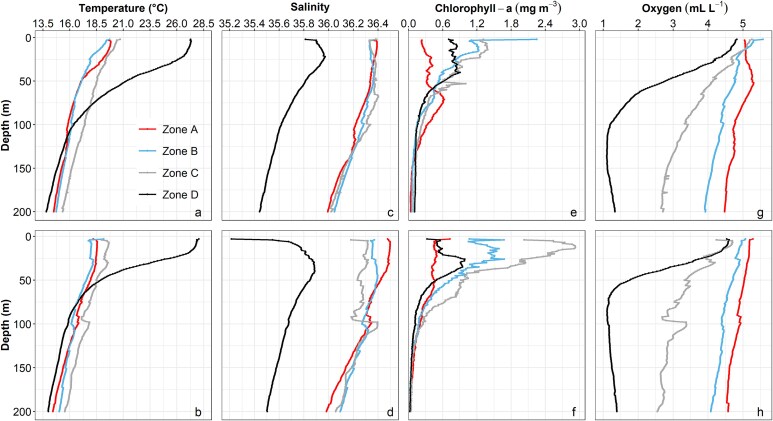
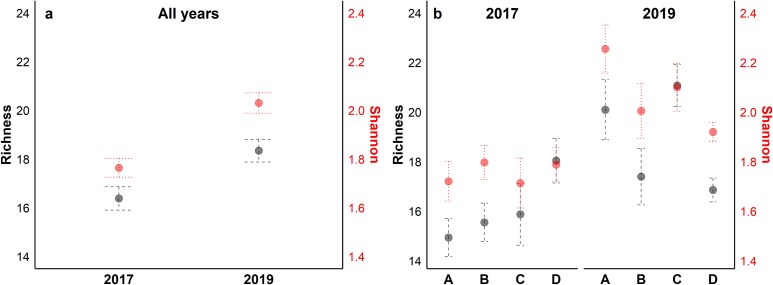
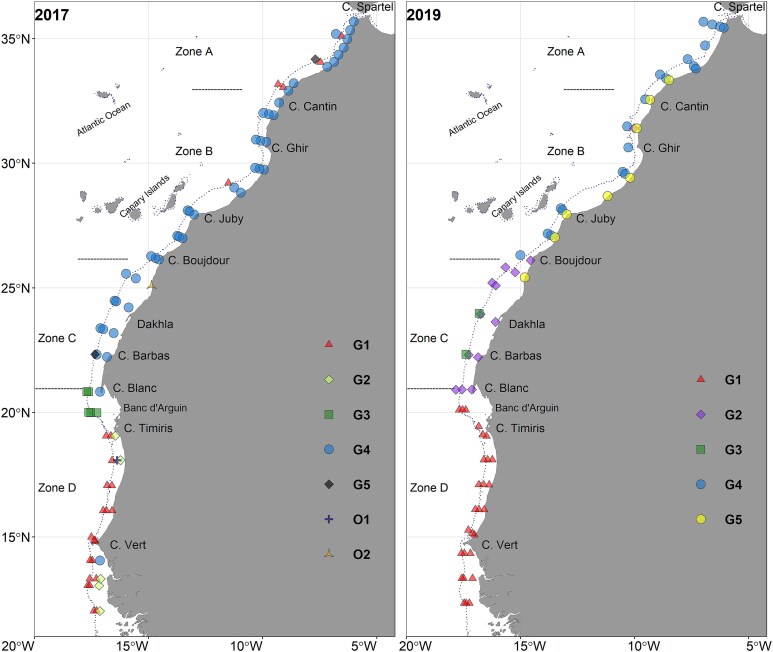
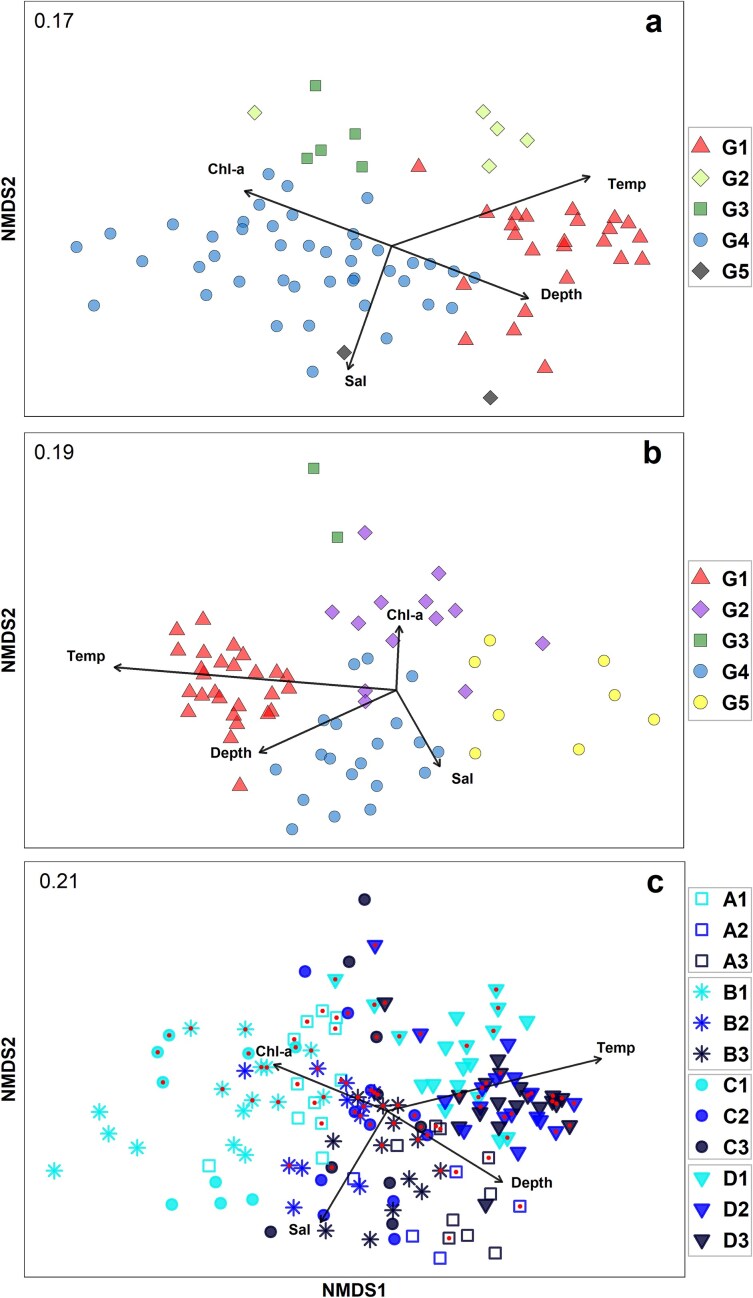
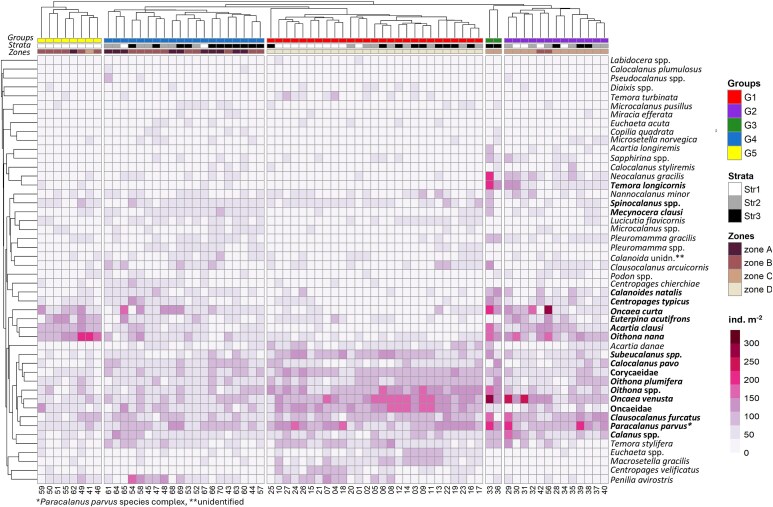
The Canary Current Large Marine Ecosystem (CCLME), extending from Cape Spartel in Morocco to Guinea-Bissau, supports high primary and fisheries productivity driven by permanent or seasonal upwelling activity. During the current study, mesozooplankton and hydrographic sampling were conducted across the CCLME in the spring/summer of 2017 and the autumn/winter of 2019. The total mesozooplankton abundance and dry weight were found to be higher in 2017, partly due to the summer reproduction cycle of diplostracans. A prominent latitudinal gradient was observed in both the mesozooplankton standing stock and assemblage structure closely linked to a significant shift in oceanographic regimes at Cape Blanc (21°N). The area south of Cape Blanc, sampled during the upwelling relaxation in both years, was occupied by warmer South Atlantic Central Waters showing elevated mesozooplankton stock with a tropical assemblage structure. In contrast, cooler and more saline waters north of Cape Blanc, a result of the upwelling regime in that area, explained part of the observed variation in mesozooplankton composition among subregions and sampling periods. Our findings indicate that aside from the upwelling activity, spatiotemporal variation of mesoscale processes and topographical features at a subregional level may also shape mesozooplankton stock and assemblage structure in the CCLME.

Keywords: Canary Current Large Marine Ecosystem; assemblage structure; coastal upwelling; copepod community; eastern boundary large marine ecosystems; mesozooplankton distribution; northwest Africa.


Figures

Fig. 1
Fig. 1
Maps of the study area in 2017 and 2019. Stations of hydrographic (CTD) and mesozooplankton (WPII) sampling are shown. Sampling directions are indicated with arrows. Major water mass circulation and oceanographic features adapted from Arístegui et al., (2009) are indicated (AC: Azores Current, CC: Canary Current, CVFZ: Cape Verde Frontal Zone, MC: Mauritanian Current, NEC: North Equatorial Current, NECC: North Equatorial Countercurrent, NACW: North Atlantic Central Water, SACW: South Atlantic Central Water). The Zones of distinct upwelling regime shown in the study area are based on Arístegui et al., (2009) and Cropper et al., (2014) [i.e. Zone A: 36°N—33°N, weak to absent upwelling; Zone B: 33°N -26°N, permanent weak upwelling; Zone C: 26°N -21°N, permanent strong upwelling; Zone D: 21°N—12°N, seasonal upwelling]. The position of the isobath 200 m is indicated with a dashed line.
Fig. 2
Fig. 2
Maps of horizontal distribution of temperature (°C), salinity, Chlorophyll-a (mg m−3) and oxygen (mL L−1) along the studied area in 2017 (a, c, e, g) and 2019 (b, d, f, h). Upwelling Zones (A, B, C, D) are shown. Contours are based on 200 CTD stations in 2017 (A: 42, B: 43, C:39, D: 76) and 132 in 2019 (A: 21, B: 43, C:19, D: 49).
Fig. 3
Fig. 3
Mean vertical profiles of temperature, salinity, Chl-a and oxygen in the upper 200 m layer of each upwelling Zone (A, B, C, D), in 2017 (a, c, e, g) and 2019 (b, d, f, h). Profiles are based on 200 CTD stations in 2017 (A: 42, B: 43, C:39, D: 76) and 132 in 2019 (A: 21, B: 43, C:19, D: 49).
Fig. 4
Fig. 4
Distribution maps of (a) total abundance and (b) total dry weight in 2017 (maximum of 30.25 g m−2 is indicated on the map) and 2019. Box plots of (c) total abundance and (d) total dry weight in the four upwelling Zones (A, B, C, and D) in 2017 and 2019. The size of the box plot is determined by the upper and lower quartiles, with the median indicated by a horizontal line within each box. Outliers are represented by dots outside the boxes. Dunn’s post hoc test output is displayed as letters above the box plots (the difference in letters signifies a statistically significant difference within each years). The number of stations of each zone is shown inside the boxes.
Fig. 5
Fig. 5
Mean taxonomic richness (left y-axis) and Shannon-Weiner index (right y-axis) calculated at the genus level for (a) 2017 and 2019 and for (b) the upwelling Zones (A, B, C, D) for each year. Vertical bars indicate standard errors. The number of stations for each zone is the same as in Fig. 4c.
Fig. 6
Fig. 6
Distribution maps of the cluster groups defined by the hierarchical clustering in 2017 and 2019 (O1, O2: outliers stations shown in Fig. S6).
Fig. 7
Fig. 7
Ordination plots of Non-Metric Multi-Dimensional Scaling (nMDS) for (a) 2017, (b) 2019, and (c) the combined data of 2017 and 2019 based on Bray–Curtis distance and square-root transformed abundance data of copepods and diplostracans (stress value is given on the top left). Environmental vectors (Temp: temperature, Sal: salinity, Chl-a: Chlorophyll-a, Depth: sampling depth) fitted to nMDS and having a significant correlation (P < 0.05) as identified with the envfit function are shown. Information of the cluster groups (G1–G5) has been superimposed in (a) and (b). Information of the combination of the upwelling Zones (A, B, C, D) and the bathymetric strata (1, 2, 3) have been superimposed in (c). Outlier stations have been omitted from the ordination. Stations sampled in 2017 have been distinguished by dots inside the symbols.
Fig. 8
Fig. 8
Heatmap of the square-root transformed abundances (ind. m−2) for taxa accounting for > 3% of the copepod and diplostracan total abundance in 2017. The colors indicate abundance values (ind m−2). The colored bars indicate groups of stations (Groups) identified by cluster analysis (Fig. S6), the bathymetric strata (1, 2, and 3), and the distinct upwelling latitudinal Zones (A, B, C, D). Copepod and diplostracan are clustered (group average) based on the Bray–Curtis distance matrix of their relative abundance. Bold font refers to taxa contributing to 70% similarity described in the SIMPER Table S5. Numbers along the bottom of the heatmap correspond to the station number as shown in Figs S1 and S6.
Fig. 9
Fig. 9
Heatmap of the square-root transformed abundances (ind. m−2) for taxa accounting for > 3% of the copepod and diplostracan total abundance in 2019. The colors indicate abundance values (ind m−2). The colored bars indicate groups of stations (Groups) identified by cluster analysis (Fig. S6), the bathymetric strata (1,2, and 3), and the distinct upwelling latitudinal Zones (A, B, C, D). Copepod and diplostracan are clustered (group average) based on the Bray–Curtis distance matrix of their relative abundance. Bold font refers to taxa contributing to 70% similarity described in the SIMPER Table S6. Numbers along the bottom of the heatmap correspond to the station number as shown in Figs S1 and S6.

Similar articles

References

    1. Anderson, M. J. (2001) A new method for non-parametric multivariate analysis of variance. Austral Ecol, 26, 32–46.
    1. Anderson, M. J. (2017) Permutational Multivariate Analysis of Variance (PERMANOVA). In Balakrishnan, N., Colton, T., Everitt, B., Piegorsch, W., Ruggeri, F. and Teugels, J. L. (eds.), Wiley StatsRef: Statistics Reference Online, John Wiley & Sons, Hoboken, NJ, pp. 1–15. 10.1002/9781118445112.stat07841. - DOI
    1. Arístegui, J., Álvarez-Salgado, X. A., Barton, E. D., Figueiras, F. G., Hernández-León, S., Roy, C. and Santos, A. M. P. (2006) Oceanography and fisheries of the Canary Current / Iberian Region of the Eastern North Atlantic (18a,E). In Allan, R. R. and Kenneth, H. B. (eds.), The Sea: The Global Coastal Ocean: Interdisciplinary Regional Studies and Syntheses (the Sea: Ideas and Observations on Progress in the Study of the Seas), Harvard University Press, Cambridge MA, pp. 877–931.
    1. Arístegui, J., Barton, E. D., Álvarez-Salgado, X. A., Santos, A. M. P., Figueiras, F. G., Kifani, S., Hernández-León, S., Mason, E.. et al. (2009) Sub-regional ecosystem variability in the canary current upwelling. Prog. Oceanogr., 83, 33–48. 10.1016/j.pocean.2009.07.031. - DOI
    1. Aronés, K., Grados, D., Ayón, P. and Bertrand, A. (2019) Spatio-temporal trends in zooplankton biomass in the northern Humboldt current system off Peru from 1961-2012. Deep Sea Res 2 Top Stud Oceanogr, 169, 104656–104170.

LinkOut - more resources