. 2025 Jan 31:13:RP96798.
doi: 10.7554/eLife.96798.

Role of hepatocyte RIPK1 in maintaining liver homeostasis during metabolic challenges

Affiliations

Role of hepatocyte RIPK1 in maintaining liver homeostasis during metabolic challenges

Weigao Zhang et al. Elife. .

Abstract

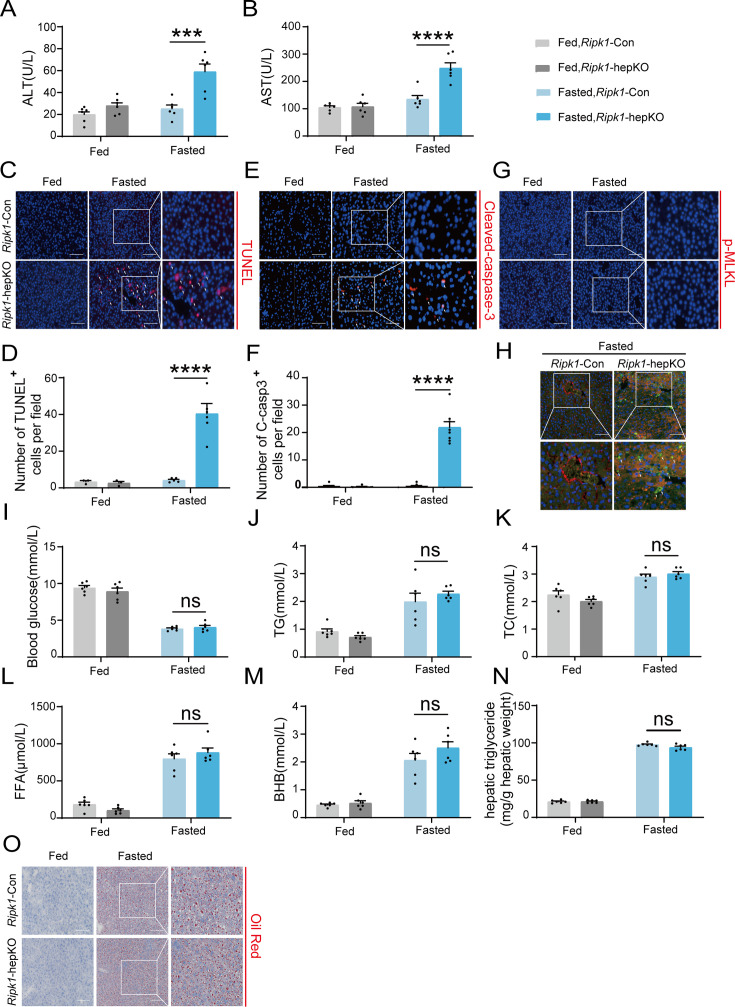
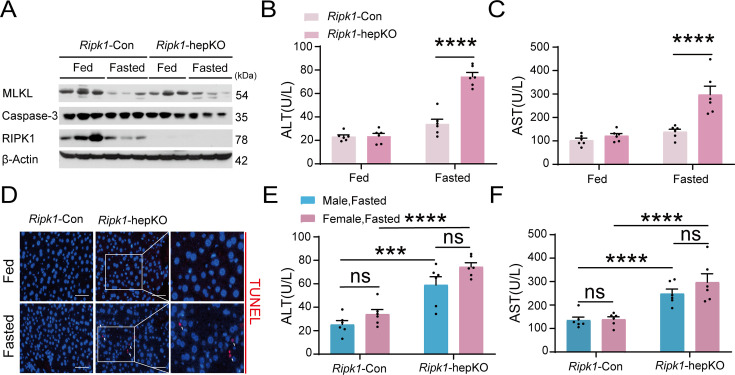
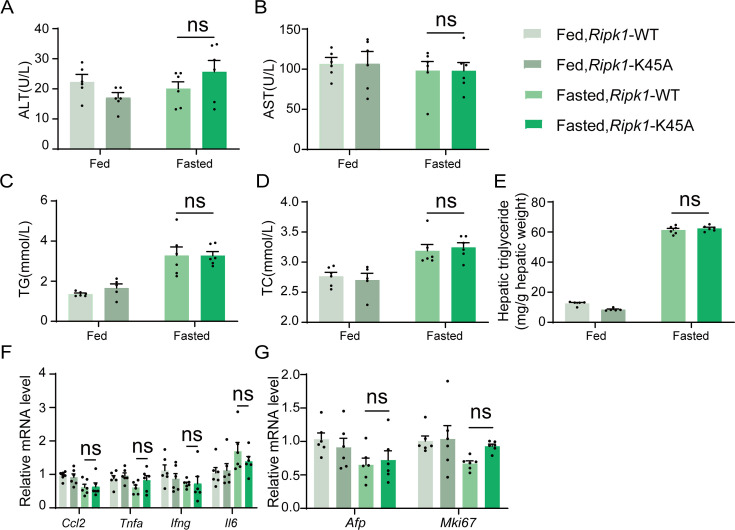
As a central hub for metabolism, the liver exhibits strong adaptability to maintain homeostasis in response to food fluctuations throughout evolution. However, the mechanisms governing this resilience remain incompletely understood. In this study, we identified Receptor interacting protein kinase 1 (RIPK1) in hepatocytes as a critical regulator in preserving hepatic homeostasis during metabolic challenges, such as short-term fasting or high-fat dieting. Our results demonstrated that hepatocyte-specific deficiency of RIPK1 sensitized the liver to short-term fasting-induced liver injury and hepatocyte apoptosis in both male and female mice. Despite being a common physiological stressor that typically does not induce liver inflammation, short-term fasting triggered hepatic inflammation and compensatory proliferation in hepatocyte-specific RIPK1-deficient (Ripk1-hepKO) mice. Transcriptomic analysis revealed that short-term fasting oriented the hepatic microenvironment into an inflammatory state in Ripk1-hepKO mice, with up-regulated expression of inflammation and immune cell recruitment-associated genes. Single-cell RNA sequencing further confirmed the altered cellular composition in the liver of Ripk1-hepKO mice during fasting, highlighting the increased recruitment of macrophages to the liver. Mechanically, our results indicated that ER stress was involved in fasting-induced liver injury in Ripk1-hepKO mice. Overall, our findings revealed the role of RIPK1 in maintaining liver homeostasis during metabolic fluctuations and shed light on the intricate interplay between cell death, inflammation, and metabolism.

Keywords: ER stress; RIPK1; fasting; immunology; inflammation; liver homeostasis; mouse.


Conflict of interest statement

WZ, HL, DZ, YY, LT, YZ, SH, XZ, QS, PL, YW, WL, JZ, HZ, YC, DW No competing interests declared

Figures

Figure 1.
Figure 1.. RIPK1 deficiency in hepatocytes sensitizes the liver to short-term fasting-induced liver injury and hepatocyte apoptosis.
(A) Serum alanine amino-transferase (ALT) levels. (B) Serum aspartate amino-transferase (AST) levels. (C, D) Representative images and quantification of TUNEL staining. Scale bar, 100 μm. (E, F) Representative images and quantification of liver sections stained with anti-cleaved caspase-3 antibody (red) and DAPI (blue). Scale bar, 100 μm. (G) Representative images of liver sections stained with anti-phospho-MLKL antibody (red) and DAPI (blue). Scale bar, 100 μm. (H) Fluorescence microscopy images of the liver stained with anti-ALB antibody (red), TUNEL (green), and DAPI (blue). Scale bar, 100 μm. (I) Blood glucose levels. (J) Serum triglycerides (TG) levels. (K) Serum total cholesterol (TC) levels. (L) Serum free fatty acids (FFA) levels. (M) Serum β-hydroxybutyrate (BHB) levels. (N) Hepatic TG levels (mg/g tissue). (O) Liver tissue was stained by Oil Red O. Scale bar, 100 μm. The data was analyzed via two- or one-way ANOVA. Data are expressed as mean ± SEM (n = 6 per group). Asterisks denote statistical significance. ns, no significant, ***p < 0.001, ****p < 0.0001.
Figure 1—figure supplement 1.
Figure 1—figure supplement 1.. RIPK1 deficiency in hepatocytes sensitizes the liver to short-term fasting-induced liver injury and hepatocyte apoptosis in female mice.
(A) Western blot analysis of MLKL, Caspase-3, RIPK1, and β-Actin in liver tissue. (B) Serum alanine amino-transferase (ALT) levels. (C) Serum aspartate amino-transferase (AST) levels. (D) Representative fluorescence microscopy images of TUNEL staining. Scale bar, 50 μm. (E, F) There was no obvious difference between male and female mice in serum ALT (E) and AST (F) levels upon fasting. The data was analyzed via two- or one-way ANOVA. Data are expressed as mean ± SEM (n = 6 per group). Asterisks denote statistical significance. ns, no significant, ***p < 0.001, ****p < 0.0001.
Figure 1—figure supplement 2.
Figure 1—figure supplement 2.. Analysis of Ripk1-WT and Ripk1-K45A mice before and after a 12-hr fasting period.
(A) Serum alanine amino-transferase (ALT) levels. (B) Serum aspartate amino-transferase (AST) levels. (C) Serum triglycerides (TG) levels. (D) Serum total cholesterol (TC) levels. (E) Hepatic TG levels (mg/g tissue). (F) Expression of inflammatory genes in the liver assessed by qPCR. (G) Transcriptional expression of Afp and Mki67 in liver tissue. The data was analyzed via two- or one-way ANOVA. Data are expressed as mean ± SEM (n = 6 per group). ns, no significant.
Figure 2.
Figure 2.. Short-term fasting-induced hepatic inflammation and compensatory proliferation in Ripk1-hepKO mice.
(A) Hepatic mRNA expression of the inflammatory molecules. (B, C) Representative images and quantification of the liver stained with anti-TNFα antibody (red) and DAPI (blue). Scale bar, 100 μm. (D) Transcriptional expression of Afp and Mki67 in liver tissue. (E) Representative images of the liver stained with anti-MKI67 antibody (brown) and hematoxylin (blue). Scale bar, 50 μm. (F) Representative flow cytometry plots showing MKI67-positive cells in the liver tissue (n = 3 per group). (G) Relative increase of MKI67-positive cells in the liver tissue of Ripk1-hepKO mice after 12 hr of fasting compared to that of Ripk1-Con mice (n = 3 per group). The data was analyzed via two- or one-way ANOVA. Data are expressed as mean ± SEM (n = 6 per group). ns, no significant, *p < 0.05, ***p < 0.001, ****p < 0.0001.
Figure 3.
Figure 3.. Transcriptome sequencing of the liver tissue from Ripk1-Con and Ripk1-hepKO mice.
(A) The volcano plot of differentially expressed genes was illustrated. The blue spots represent the down-regulated genes in Ripk1-hepKO group compared with control (Ripk1-Con) group, and the red spots represent the up-regulated genes in Ripk1-hepKO group. (B) The altered signaling pathways were enriched by Kyoto Encyclopedia of Genes and Genomes (KEGG) analysis. (C) The genes which expression were significantly altered in Ripk1-hepKO group were depicted in the heatmap. (D, E) Representative fluorescence microscopy images and quantification of the liver stained with anti-F4/80 antibody (red), anti-CD11b antibody (red), anti-CCR2 antibody (red), anti-CX3CR1 antibody (red), and DAPI (blue), respectively. Scale bar, 100 μm. The data was analyzed via two- or one-way ANOVA. Data are expressed as mean ± SEM (n = 6 per group). ns, no significant, **p < 0.01, ***p < 0.001, ****p < 0.0001.
Figure 3—figure supplement 1.
Figure 3—figure supplement 1.. Transcriptome sequencing of the liver tissue from Ripk1-Con and Ripk1-hepKO mice.
(A) The volcano plot of differentially expressed genes was illustrated. The blue spots represent the down-regulated genes in fasted group compared with control (fed) group and the red spots represent the up-regulated genes in Ripk1-Con mice. (B) The altered signaling pathways were enriched by Kyoto Encyclopedia of Genes and Genomes (KEGG) analysis. (C) The genes which expression were significantly altered in fasted group were depicted in the heatmap. (D) The volcano plot of differentially expressed genes was illustrated. The blue spots represent the down-regulated genes in Ripk1-hepKO group compared with control (Ripk1-Con) group and the red spots represent the up-regulated genes in Ripk1-hepKO group. (E) The altered signaling pathways were enriched by KEGG analysis.
Figure 4.
Figure 4.. Single-cell RNA sequencing of liver tissue from Ripk1-Con and Ripk1-hepKO mice.
(A) T-distributed stochastic neighbor embedding (t-SNE) plots display color-coded cell subtypes of cells in the Ripk1-Con (left) and Ripk1-hepKO (right) mice liver tissues. (B) Bar charts display the proportion of major cell subtypes within all different genotypes after fasting. (C) The altered signaling pathways associated with differential gene changes in macrophages were enriched by Kyoto Encyclopedia of Genes and Genomes (KEGG) analysis. (D) t-SNE plots display color-coded cell subtypes of macrophages in the Ripk1-Con (left) and Ripk1-hepKO (right) mice liver tissues. (E) Bar charts display the proportion of major cell subtypes within macrophages after fasting. (F) Representative flow cytometry plots of F4/80- and CD11b-positive cells in the liver tissue (n = 3 per group). (G) Relative increase of F4/80- and CD11b-positive cells in the liver tissue of Ripk1-hepKO mice after 12 hr of fasting, compared to that in Ripk1-Con mice (n = 3 per group; unpaired t-test). (H) Bar charts display the number of interactions among cell types across the experiments. (I) Bar charts displaying the interaction strength among cell types across the experiments. (J) Circle plots displaying the brand link pairs between macrophages and other cell types, along with their corresponding event counts. (K) Heatmaps summarizing specific signals among interacting cell types in the liver tissue of Ripk1-hepKO mice after 12 hr of fasting, compared to that in Ripk1-Con mice. Interactions are categorized into outgoing and incoming events for specific cell types. The color gradient indicates the relative strength of these interactions (NK&T: natural killer cells and T cells; ECs: endothelial cells; PCs: plasma cells; Mac: macrophages; DCs: dendritic cells). The data was analyzed via two- or one-way ANOVA. Data are expressed as mean ± SEM (n = 6 per group). **p < 0.01.
Figure 4—figure supplement 1.
Figure 4—figure supplement 1.. Single-cell RNA sequencing of liver tissue from Ripk1-Con and Ripk1-hepKO mice.
(A) T-distributed stochastic neighbor embedding (t-SNE) visualization depicting the clustering of liver cells based on 22,274 single-cell transcriptomes. (B) Heatmap illustrating the marker genes associated with each cluster. (C) t-SNE plots displaying color-coded cell clusters of cells in the Ripk1-Con (left) and Ripk1-hepKO (right) mice liver tissues. (D) Bar charts showing the proportion of major cell clusters among all cells at different genotypes after fasting by scRNA-seq. (E) Circle plots displaying putative ligand–receptor interactions among eight cell subtypes in the liver tissue of Ripk1-Con (top) and Ripk1-hepKO (bottom) mice. (F) All significant signaling pathways were ranked based on their differences in overall information flow within the inferred networks between Ripk1-Con and Ripk1-hepKO mice. The overall information flow of a signaling network was calculated by summing all the communication probabilities within that network.
Figure 5.
Figure 5.. Inhibitor of ER stress 4-PBA effectively rescued the fasting-induced liver injury and inflammation in Ripk1-hepKO mice.
(A) Western blot analysis of p-IRE1α, IRE1α, BIP, CHOP, RIPK1, and GAPDH in liver tissue. (B) Experiment schema. (C) Transcriptional expression of ER stress genes in mouse liver. (D) Serum alanine amino-transferase (ALT) and aspartate amino-transferase (AST) levels. (E, F) Fluorescence microscopy image and quantification of TUNEL staining. Scale bar, 100 μm. (G) Expression (qPCR) of inflammatory genes in the livers. (H) Expression (qPCR) of Afp in the livers. The data was analyzed via two- or one-way ANOVA. Data are expressed as mean ± SEM (n = 6 per group). ns, no significant, *p < 0.05, **p < 0.01, ***p < 0.001, ****p < 0.0001.
Figure 6.
Figure 6.. AAV-TBG-Cre-mediated liver-specific RIPK1 knockout confirms fasting-induced acute liver injury in mice.
(A) Schema of AAV8-TBG-Cre administration. (B) Western blot analysis of p-IRE1α, IRE1α, BIP, CHOP, TNFα, RIPK1, and GAPDH in liver tissue. (C) Serum alanine amino-transferase (ALT) levels. (D) Serum aspartate amino-transferase (AST) levels. (E, F) Fluorescence microscopy image and quantification of TUNEL staining. Scale bar, 100 μm. (G) Serum triglycerides (TG) levels. (H) Serum total cholesterol (TC) levels. (I) Hepatic TG levels (mg/g tissue). (J) Expression (qPCR) of ER stress genes in the livers. (K) Expression (qPCR) of inflammatory genes in the livers. (L, M) Fluorescence microscopy images and quantification of liver of Ripk1-hepKO and control mice stained with anti-cleaved caspase-3 antibody (red) and DAPI (blue). Scale bar, 100 μm. The data was analyzed via two- or one-way ANOVA. Data are expressed as mean ± SEM (n = 6 per group). ns, no significant, *p < 0.05, **p < 0.01, ****p < 0.0001.
Figure 7.
Figure 7.. Short-term high-fat diet (HFD) feeding induced liver injury, hepatic apoptosis, inflammation, and endoplasmic reticulum stress in Ripk1-hepKO mice.
(A) Schema of HFD administration. (B) Liver tissue was stained by Oil Red O. Scale bar, 100 μm. (C) Hepatic triglyceride (TG) levels (mg/g tissue). (D) Serum total cholesterol (TC) levels. (E) Serum alanine amino-transferase (ALT) levels. (F) Serum aspartate amino-transferase (AST) levels. (G, H) Fluorescence microscopy image and quantification of TUNEL staining. Scale bar, 50 μm. (I) Expression (qPCR) of inflammatory genes in the livers. (J) Expression (qPCR) of Afp in the livers. (K) Expression (qPCR) of ER stress markers in the livers. The data was analyzed via two- or one-way ANOVA. Data are expressed as mean ± SEM (n = 6 per group). ns, no significant, *p < 0.05, **p < 0.01, ****p < 0.0001.
Author response image 1.

Update of

  • doi: 10.1101/2024.03.04.583302
  • doi: 10.7554/eLife.96798.1
  • doi: 10.7554/eLife.96798.2

Similar articles

Cited by

References

    1. Aparicio-Vergara M, Tencerova M, Morgantini C, Barreby E, Aouadi M. Isolation of kupffer cells and hepatocytes from a single mouse liver. Methods in Molecular Biology. 2017;1639:161–171. doi: 10.1007/978-1-4939-7163-3_16. - DOI - PubMed
    1. Bernardo-Seisdedos G, Bilbao J, Fernández-Ramos D, Lopitz-Otsoa F, Gutierrez de Juan V, Bizkarguenaga M, Mateos B, Fondevila MF, Abril-Fornaguera J, Diercks T, Lu SC, Nogueiras R, Mato JM, Millet O. Metabolic landscape of the mouse liver by quantitative31 p nuclear magnetic resonance analysis of the phosphorome. Hepatology. 2021;74:148–163. doi: 10.1002/hep.31676. - DOI - PMC - PubMed
    1. Bettermann K, Vucur M, Haybaeck J, Koppe C, Janssen J, Heymann F, Weber A, Weiskirchen R, Liedtke C, Gassler N, Müller M, de Vos R, Wolf MJ, Boege Y, Seleznik GM, Zeller N, Erny D, Fuchs T, Zoller S, Cairo S, Buendia MA, Prinz M, Akira S, Tacke F, Heikenwalder M, Trautwein C, Luedde T. TAK1 suppresses a NEMO-dependent but NF-kappaB-independent pathway to liver cancer. Cancer Cell. 2010;17:481–496. doi: 10.1016/j.ccr.2010.03.021. - DOI - PubMed
    1. Clucas J, Meier P. Roles of RIPK1 as a stress sentinel coordinating cell survival and immunogenic cell death. Nature Reviews. Molecular Cell Biology. 2023;24:835–852. doi: 10.1038/s41580-023-00623-w. - DOI - PubMed
    1. Cotter DG, Ercal B, d’Avignon DA, Dietzen DJ, Crawford PA. Impairments of hepatic gluconeogenesis and ketogenesis in PPARα-deficient neonatal mice. American Journal of Physiology. Endocrinology and Metabolism. 2014;307:E176–E185. doi: 10.1152/ajpendo.00087.2014. - DOI - PMC - PubMed

Substances

Associated data

LinkOut - more resources