. 2025 Apr;55(4):56.
doi: 10.3892/ijmm.2025.5497. Epub 2025 Jan 31.

Transcriptomics and proteomics characterizing the antioxidant mechanisms of semaglutide in diabetic mice with cognitive impairment

Affiliations

Transcriptomics and proteomics characterizing the antioxidant mechanisms of semaglutide in diabetic mice with cognitive impairment

Ying Yang et al. Int J Mol Med. 2025 Apr.

Abstract

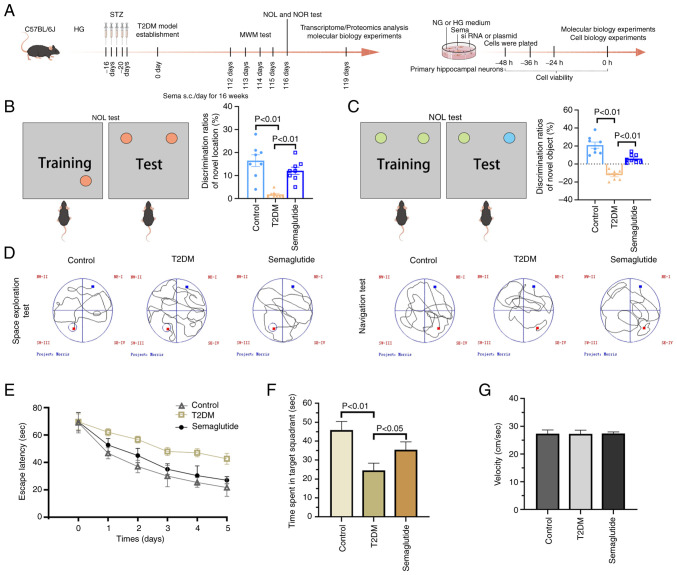
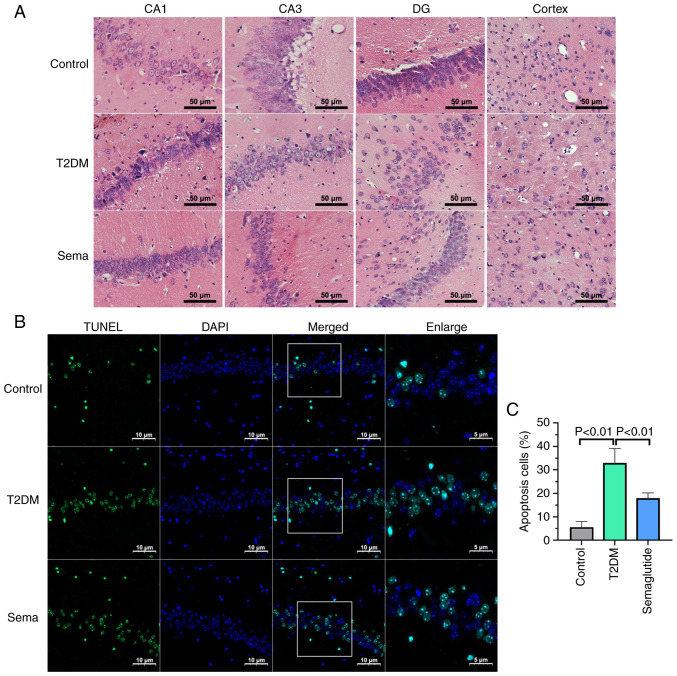
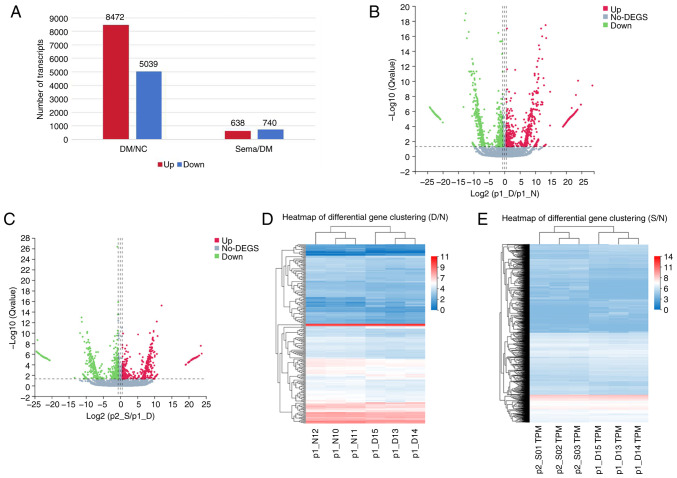
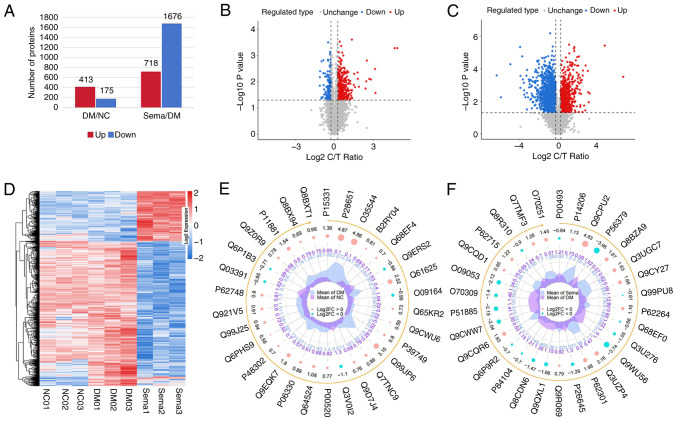
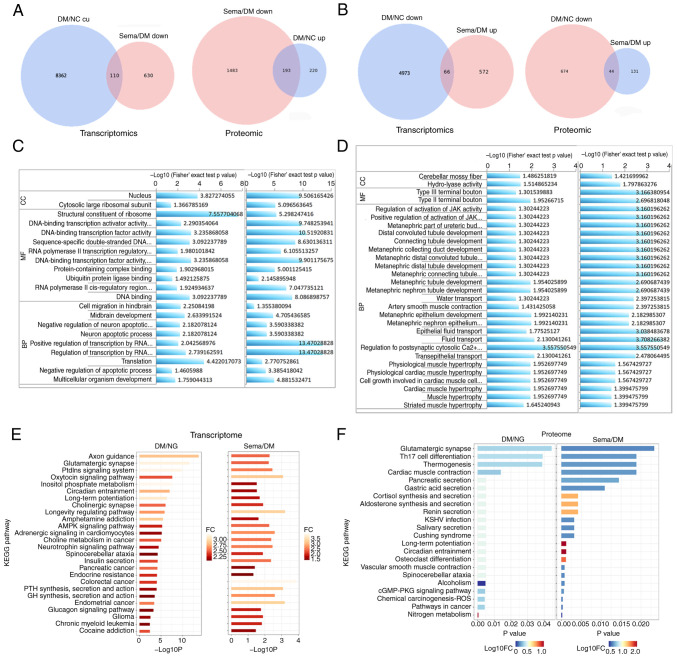
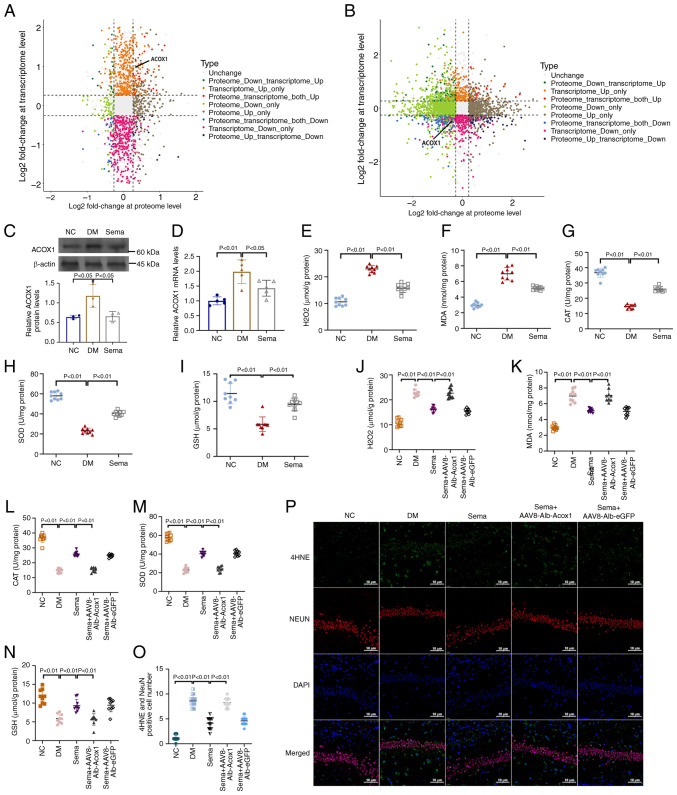
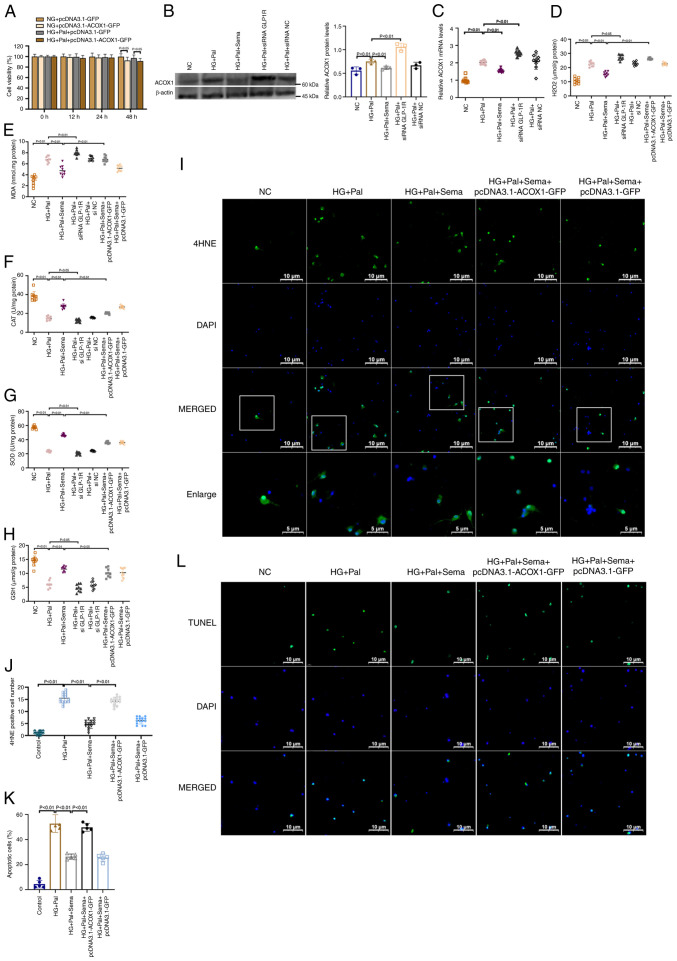
The aim of the present study was to investigate the neuroprotective effects of semaglutide in diabetes‑associated cognitive decline (DACD), while also exploring the underlying mechanisms targeting anti‑oxidative effects. The present study evaluated the antioxidant properties of semaglutide using a DACD model of inflammation. To investigate the underlying mechanisms, omics technologies were employed. Comprehensive transcriptomic and proteomic analysis of the cells was conducted to identify the pathways responsible for the observed antioxidant effects. Semaglutide demonstrated the potential to enhance learning and memory functions while mitigating hippocampal pathological damage. RNA‑sequencing and data‑independent acquisition proteomics analyses identified 13,511 differentially expressed genes and 588 differentially expressed proteins between the control and type 2 diabetes mellitus (T2DM) groups. In addition, 1,378 genes and 2,394 proteins exhibited a differential expression between the T2DM and semaglutide (10 µg/kg) treatment groups. A combined transcriptomic and proteomic analysis unveiled 40 common pathways. Acyl‑CoA oxidase 1 (ACOX1) was observed to be activated during oxidative stress and subsequently suppressed by semaglutide. Of note, the antioxidant and anti‑apoptotic properties of semaglutide in high glucose (HG) conditions were partially reversed upon ACOX1 overexpression. Overall, the present data provided molecular evidence to elucidate the physiological connections between semaglutide and neuronal function, and contribute to clarifying the role of semaglutide in combating oxidative stress and HG‑induced cognitive impairment.

Keywords: cognitive; diabetes; oxidative stress; proteomic; transcriptomic.


Conflict of interest statement

The authors declare that they have no competing interests.

Figures

Figure 1
Figure 1
Hyperglycemia has the potential to impair cognitive function. (A) Experimental design. (B) Schematic drawing of novel location and quantification of the ratio of exploration time on novel objective location in both groups of mice. (C) Schematic drawing of novel objective object and quantification of the ratio of exploration time on novel objective object in both groups of mice. (D) Path map of the MWM. (E) Average escape latency from the positioning navigation tests. (F) Time spent in target quadrant in space exploration tests. (G) Swim speed during MWM trials. Data are presented as the mean ± SD (n=3). MWM, Morris water maze; T2DM, type II diabetes mellitus; NOR, novel object recognition; NOL novel object location recognition.
Figure 2
Figure 2
Hyperglycemia leads to damage in hippocampal tissue. (A) Representative images of H&E staining in CA1, CA3, DG and Cortex zones (magnification, ×400). (B) Representative confocal images depict neuronal apoptosis in hippocampal tissues, indicated by TUNEL (green) and DAPI (blue) staining. (C) The bar graph illustrates the relative percentage of apoptotic neuronal cells in the hippocampal tissue, determined through TUNEL staining, across the three groups of mice (n=3). Data are presented as the mean ± SD. Graphs are representative of three independent experiments. T2DM, type II diabetes mellitus.
Figure 3
Figure 3
Differential analysis in RNA expression levels in the hippocampus of different groups. (A) Histogram of differential gene expression among different groups. (B and C) Volcano plots showing relative abundances of transcripts in three groups. The transcripts were considered differentially expressed at fold change >1.5 and with statistical significance (P<0.05) between groups. The green points represent the downregulated genes, and the red points represent the regulated genes that were statistically significant. (D and E) Heatmaps of selected DEGs in different groups, where light red represents high expression and light blue represents low expression. DEGs, differentially expressed genes.
Figure 4
Figure 4
Differential analysis in protein expression levels in different groups. (A) Histogram of differential protein expression among different groups. (B and C) Volcano plots showing relative abundances of proteins in three groups. The proteins were considered differentially expressed at fold change >1.2 and with statistical significance (P<0.05) between groups. The red points represent the upregulated proteins, and the green points represent the downregulated proteins that were statistically significant. (D) Heatmaps of selected differentially expressed proteins in different groups, where light red represents high expression and light blue represents low expression. (E and F) Radar plots of protein expression among the different groups. DM, diabetes mellitus; NC, negative control.
Figure 5
Figure 5
Common differentially expressed genes/differentially expressed proteins, GO enrichment and KEGG pathway analysis in Transcriptome and Proteome. (A) Overlapped mRNAs (left) and proteins (right) between the upregulated Control-vs.-T2DM group and decreased Sema vs. T2DM group. (B) Overlapped mRNAs (left) and proteins (right) between the decreased Control-vs.-T2DM group and upregulated Sema vs. T2DM group. (C) Overlapped GO in the Control group vs. the T2DM group (left) and Sema vs. T2DM group (right) at the transcriptomic level. (D) Overlapped GO in the Control-vs.-T2DM group (left) and Sema vs. T2DM group (right) at the proteomic level. (E) Overlapped KEGG pathways in the Control-vs.-T2DM group (left) and Sema vs. T2DM group (right) at the transcriptomic level. (F) Overlapped KEGG pathways in the Control-vs.-T2DM group (left) and Sema vs. T2DM group (right) at the proteomic level. GO, Gene Ontology; KEGG, Kyoto Encyclopedia of Genes and Genomes; T2DM, type 2 diabetes mellitus.
Figure 6
Figure 6
Correlation between transcriptome and proteome. (A) DM vs. NC. (B) Sema vs. DM, nine-quadrant graph (considering the statistical significance, P<0.05). The x-axis (abscissa) shows the log2 fold change of the protein levels. The y-axis (ordinate) shows the log2 fold change of the transcriptome levels. The top of the figure displays the Pearson correlation coefficient and its associated statistical significance (P-value) between the transcriptome and proteome data. Each dot represents a gene and its corresponding protein. Grey dots indicate genes and proteins that show no significant change in expression. Red dots represent genes and proteins that exhibit similar trends (upregulation). Blue dots represent genes and proteins that exhibit opposite trends in expression (downregulation). (C) Western blot images. (D) Quantification of western blot bands. Examination for (E) H2O2, (F) MDA, (G) CAT, (H) SOD and (I) GSH in hippocampus tissues of three groups of mice. Examination for (J) H2O2, (K) MDA, (L) CAT, (M) SOD and (N) GSH in hippocampus tissues of mice treated with or without Sema + AAV8-Alb-Acox1. n=3 (O) Immunofluorescent staining for 4-HNE expression in hippocampal sections. (P) Positive fluorescent intensity of 4-HNE was quantified after IF analysis. DM, diabetes mellitus; NC, negative control; MDA, malondialdehyde; CAT, catalase; SOD, superoxide dismutase; GSH, glutathione.
Figure 7
Figure 7
Semaglutide mitigates oxidative stress through the inhibition of the ACOX1. (A) The Cell Counting Kit-8 assay of cell viability of different time of pcDNA3.1-ACOX1-GFP on primary microglia (n=3). (B) Western blot analysis of ACOX1 in primary hippocampal neurons; graphs are representative of three independent experiments (n=3). (C) mRNA expression for ACOX1 in primary microglia (n=3). Examination for (D) H2O2, (E) MDA, (F) CAT, (G) SOD and (H) GSH in cells in all groups. (I) The representative images of immunofluorescence staining with 4HNE immunofluorescence (green) and nuclei (blue) in hippocampal neurons (magnification, ×500). A total of five fields were randomly selected for observation. (J) Quantitation of immunofluorescence for 4HNE in primary neurons (n=3). (K) Bar graph of the proportion of apoptotic cells. (L) Representative confocal images show TUNEL (green) and DAPI (blue) staining of Primary microglia (magnification, ×400). A total of five fields were randomly selected for observation. ACOX1, Acyl-CoA oxidase 1; MDA, malondialdehyde; CAT, catalase; SOD, superoxide dismutase; GSH, glutathione; HG, high glucose; Pal, palmitic acid; NC, negative control.

Similar articles

Cited by

References

    1. Biessels GJ, Whitmer RA. Cognitive dysfunction in diabetes: How to implement emerging guidelines. Diabetologia. 2020;63:3–9. doi: 10.1007/s00125-019-04977-9. - DOI - PMC - PubMed
    1. Biessels GJ, Despa F. Cognitive decline and dementia in diabetes mellitus: Mechanisms and clinical implications. Nat Rev Endocrinol. 2018;14:591–604. doi: 10.1038/s41574-018-0048-7. - DOI - PMC - PubMed
    1. Moore EM, Mander AG, Ames D, Kotowicz MA, Carne RP, Brodaty H, Woodward M, Boundy K, Ellis KA, Bush AI, et al. Increased risk of cognitive impairment in patients with diabetes is associated with metformin. Diabetes Care. 2013;36:2981–2987. doi: 10.2337/dc13-0229. - DOI - PMC - PubMed
    1. Simó R, Ciudin A, Simó-Servat O, Hernández C. Cognitive impairment and dementia: A new emerging complication of type 2 diabetes-The diabetologist's perspective. Acta Diabetol. 2017;54:417–424. doi: 10.1007/s00592-017-0970-5. - DOI - PubMed
    1. Zilliox LA, Chadrasekaran K, Kwan JY, Russell JW. Diabetes and cognitive impairment. Curr Diab Rep. 2016;16:87. doi: 10.1007/s11892-016-0775-x. - DOI - PMC - PubMed

MeSH terms

LinkOut - more resources