. 2025 May;24(5):e14501.
doi: 10.1111/acel.14501. Epub 2025 Jan 30.

CAV1 Exacerbates Renal Tubular Epithelial Cell Senescence by Suppressing CaMKK2/AMPK-Mediated Autophagy

Affiliations

CAV1 Exacerbates Renal Tubular Epithelial Cell Senescence by Suppressing CaMKK2/AMPK-Mediated Autophagy

Liya Sun et al. Aging Cell. 2025 May.

Abstract

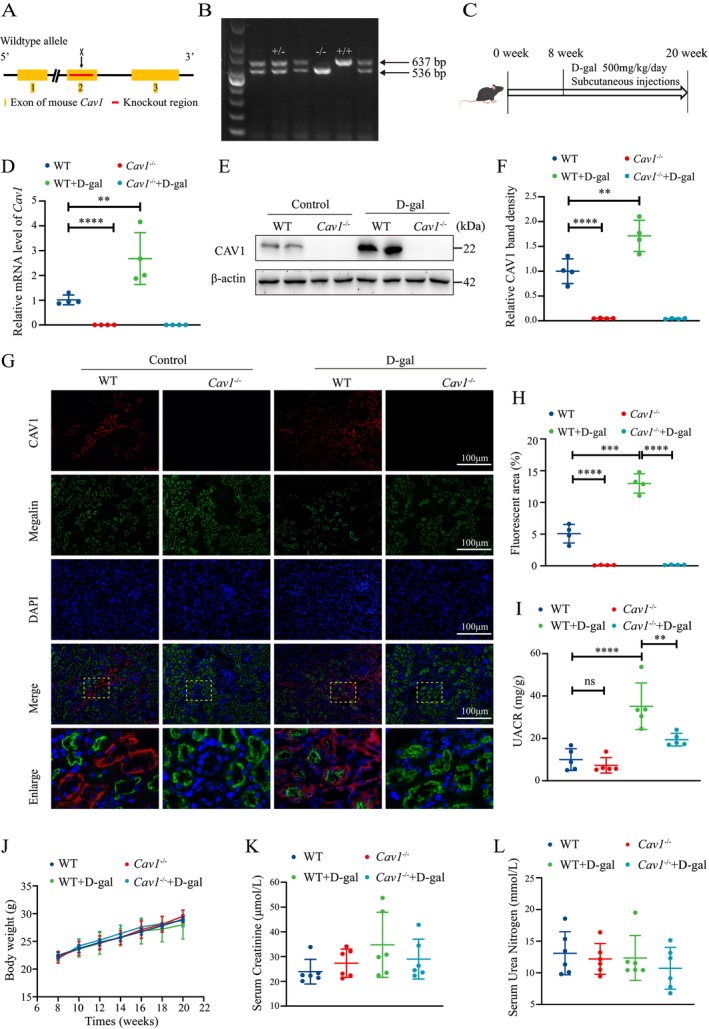
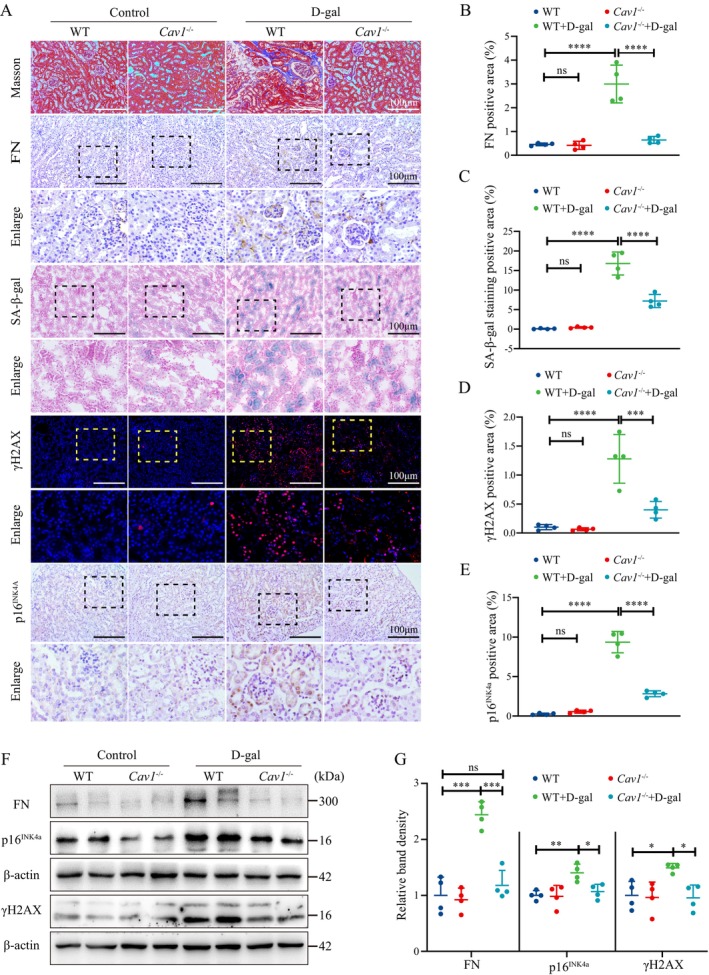
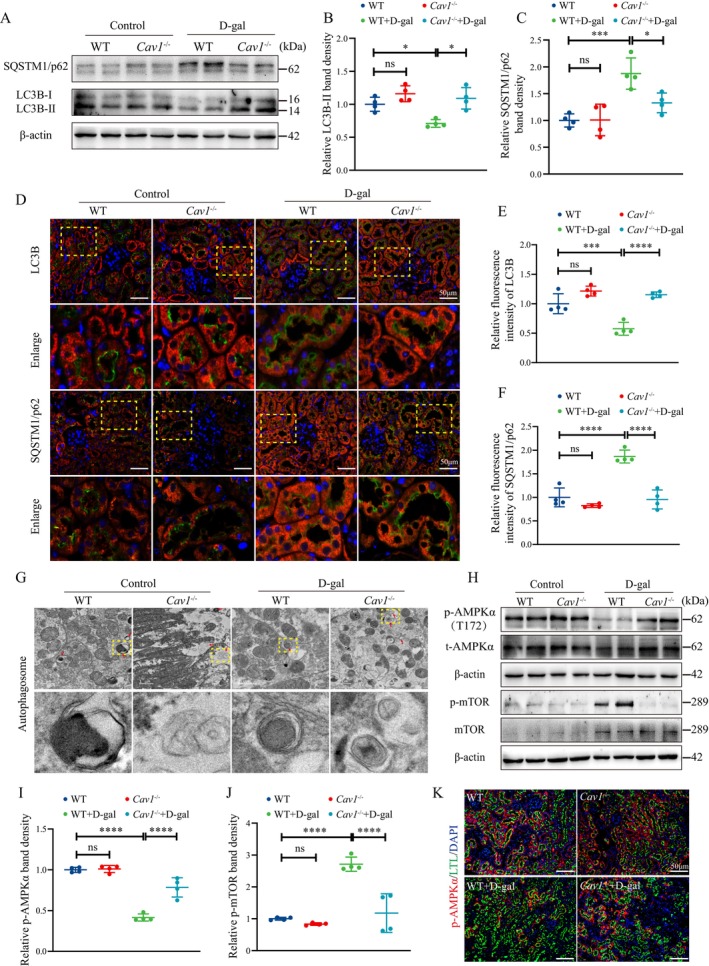
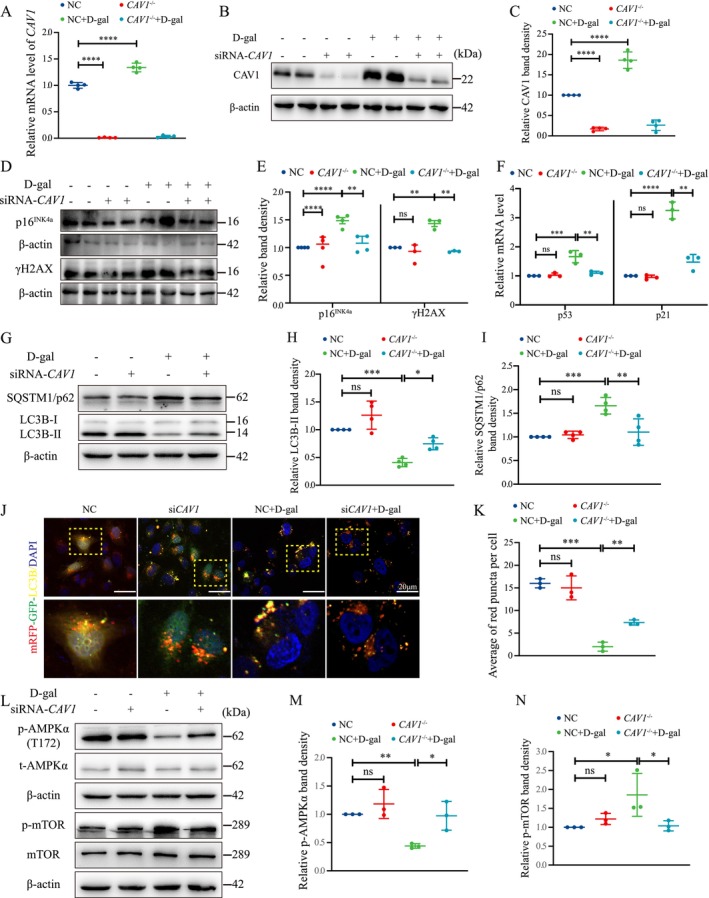
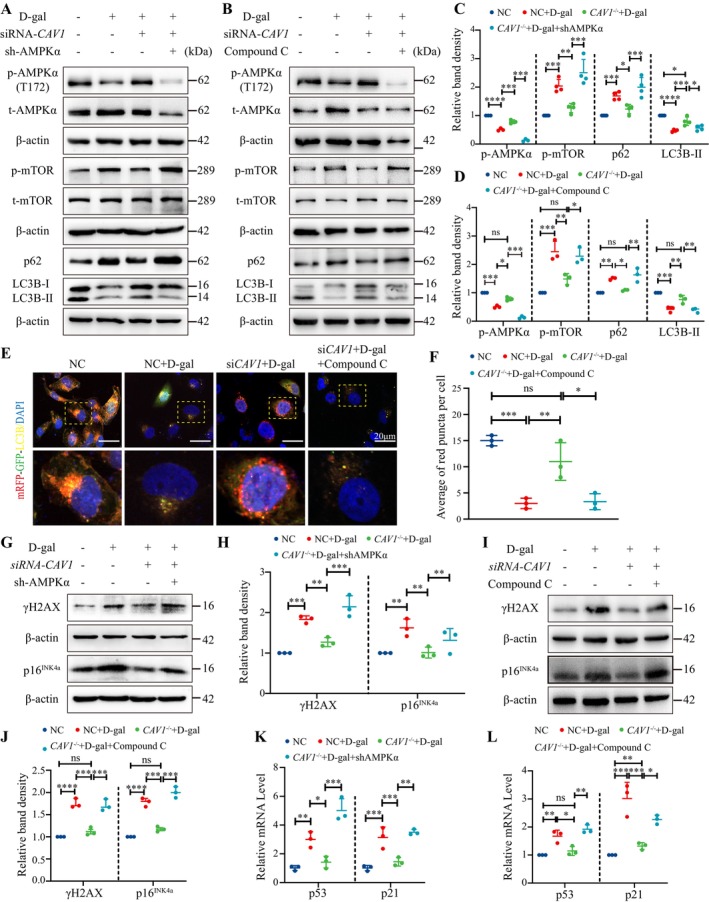
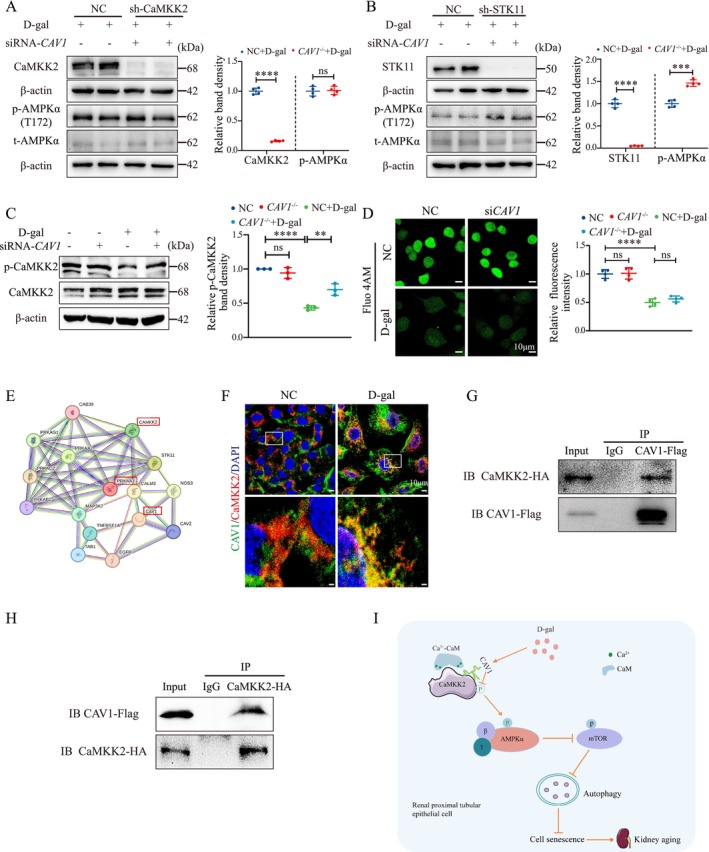
Renal proximal tubular epithelial cell (PTEC) senescence and defective autophagy contribute to kidney aging, but the mechanisms remain unclear. Caveolin-1 (CAV1), a crucial component of cell membrane caveolae, regulates autophagy and is associated with cellular senescence. However, its specific role in kidney aging is poorly understood. In this study, we generated Cav1 gene knockout mice and induced kidney aging using D-galactose (D-gal). The results showed that CAV1 expression increased in the renal cortex of the aging mice, which was accompanied by exacerbated renal interstitial fibrosis, elevated levels of senescence-associated proteins γH2AX and p16INK4a, and increased β-galactosidase activity. Moreover, autophagy and AMPK phosphorylation in PTECs were reduced. These phenotypes were partially reversed in D-gal-induced Cav1 knockout mice. Similar results were observed in D-gal-induced human proximal tubular epithelial (HK-2) cells, but these effects were blocked when AMPK activation was inhibited. Additionally, in CaMKK2 knockdown HK-2 cells, siCAV1 failed to promote AMPK phosphorylation, whereas this effect persisted when STK11 was knocked down. Besides, we examined the phosphorylation of CaMKK2 and found that siCAV1 increased its activity. Given that CaMKK2 activity is affected by intracellular Ca2+, we examined Ca2+ levels in HK-2 cells and found that D-gal treatment reduced intracellular Ca2+ concentration, but CAV1 knockdown did not alter these levels. Through GST pull-down assays, we demonstrated a direct interaction between CAV1 and CaMKK2. In conclusion, these findings suggest that CAV1 exacerbates renal tubular epithelial cell senescence by directly interacting with CaMKK2, suppressing its activity and AMPK-mediated autophagy via a Ca2+-independent pathway.

Keywords: AMPK; CAV1; CaMKK2; Autophagy; Kidney Aging; Renal Tubular Epithelial Cell.


Conflict of interest statement

The authors declare no conflicts of interest.

Figures

FIGURE 1
FIGURE 1
Upregulation of CAV1 expression in renal tissues of aging mice induced by D‐gal. (A) Schematic representation of the strategy for generation of Cav1 gene knockout mouse. (B) Genotyping of Cav1 by PCR amplification of mouse tail DNA and agarose gel electrophoresis. (C) Schematic diagram of the D‐gal‐induced aging mouse model, with continuous subcutaneous injections of D‐gal into the cervical dorsal region from 8 to 20 weeks of age. (D) qPCR analysis of the mRNA expression of Cav1 in renal cortex tissues (n = 4). (E) Western blot analysis of CAV1 protein expression. (F) Semiquantitative analysis of CAV1 protein levels (n = 4). (G) IF staining analysis of CAV1 expression in the kidney: CAV1 (red), proximal tubule marker Megalin (green), and nuclei (blue). (H) Semiquantitative analysis of CAV1‐positive areas from the IF staining (n = 4). (I) UACR levels. (J) Changes in body weight of mice. (K) Serum creatinine levels. (L) Serum urea nitrogen levels. ****p < 0.0001, ***p < 0.001, **p < 0.01.
FIGURE 2
FIGURE 2
Cav1 Deficiency alleviates D‐gal‐induced kidney aging. (A) Representative images of Masson and SA‐β‐Gal staining of renal tissues, IHC staining for FN and p16INK4a, and IF staining for γH2AX (Red fluorescence indicates γH2AX staining, blue fluorescence indicates nuclear staining). (B) Semiquantitative analysis of FN‐positive areas from the IHC staining in the kidney (n = 4); (C) Semiquantitative analysis of SA‐β‐Gal‐positive areas (n = 4). (D) Semiquantitative analysis of γH2AX‐positive areas from the IF staining (n = 4). (E) Semiquantitative analysis of p16INK4a‐positive areas from IHC staining (n = 4). (F) Representative western blot analysis of FN, γH2AX, and p16INK4a protein expression in renal cortex. (G) Semiquantitative analysis of FN, γH2AX, and p16INK4a protein expression relative to β‐Actin (n = 4); ****p < 0.0001, ***p < 0.001, **p < 0.01, *p < 0.05, ns indicates p > 0.05.
FIGURE 3
FIGURE 3
Cav1 Knockout enhances autophagy and AMPK activity in PTECs of D‐gal‐induced aging mice. (A) Western blot analysis of LC3B‐II and SQSTM1/p62 protein expression in renal cortex tissues. (B) Semiquantitative analysis of LC3B‐II/β‐Actin protein expression (n = 4). (C) Semiquantitative analysis of SQSTM1/p62 protein expression (n = 4). (D) IF double staining of LC3B and SQSTM1/p62 with the proximal tubule marker Megalin, respectively: Red fluorescence indicates LC3B and SQSTM1/p62, green fluorescence indicates Megalin, and blue fluorescence indicates nuclei. (E) Semiquantitative analysis of the relative average fluorescence intensity of LC3B (n = 4). (F) Semiquantitative analysis of the relative average fluorescence intensity of SQSTM1/p62 (n = 4). (G) Transmission electron microscopy showing autophagosomes/autolysosomes in PTECs. (H) Western blot analysis of AMPK and mTOR and their corresponding phosphorylated proteins in the renal cortex. (I) Semiquantitative analysis of p‐AMPKα/β‐Actin protein expression (n = 4). (J) Semiquantitative analysis of p‐mTOR/β‐Actin protein expression (n = 4). (K) Representative IF double staining: Green for the proximal tubule marker LTL, red for p‐AMPKα fluorescence, and blue for nuclei. ****p < 0.0001, ***p < 0.001, *p < 0.05, ns indicates p > 0.05.
FIGURE 4
FIGURE 4
siCAV1 Alleviates D‐gal‐induced HK‐2 cells senescence. (A) qPCR analysis of CAV1 mRNA expression in D‐gal‐treated HK‐2 cells (n = 4). (B) Western blot analysis of CAV1 protein expression. (C) Semiquantitative analysis of CAV1 protein expression (n = 4). (D) Western blot analysis of p16INK4a and γH2AX protein expression in D‐gal‐treated HK‐2 cells. (E) Semiquantitative analysis of p16INK4a and γH2AX protein expression (n = 3 or 4). (F) qPCR analysis of the mRNA expression of p53 and p21 in D‐gal‐treated HK‐2 cells (n = 4). (G) Western blot analysis of LC3B and SQSTM1 protein expression in HK‐2 cells; (H) Semiquantitative analysis of LC3B‐II/β‐Actin in HK‐2 cells (n = 4). (I) Semiquantitative analysis of SQSTM1/p62 protein expression in HK‐2 cells (n = 4). (J) Autophagic flux analysis: HK‐2 cells were transfected with mRFP‐GFP‐LC3B plasmids for 24 h, followed by transfection with siCAV1 or NC, and then treated with 200 mM D‐gal for 72 h: Autophagosomes appear as yellow dots, autolysosomes appear as red dots, and nuclei are stained with DAPI (blue). (K) Quantification of red fluorescent punctas per cell. (L) Western blot analysis of AMPK and mTOR phosphorylation levels. (M) Semiquantitative analysis of p‐AMPKα/β‐Actin protein expression (n = 3). (N) Semiquantitative analysis of p‐mTOR/β‐Actin protein expression (n = 3). ****p < 0.0001, ***p < 0.001, **p < 0.01, *p < 0.05, ns indicates p > 0.05.
FIGURE 5
FIGURE 5
Inhibition of AMPK activation reverses the alleviating effects of siCAV1 on D‐gal‐treated HK‐2 cells. (A) Western blot analysis of AMPK and mTOR phosphorylation, LC3B, and SQSTM1/p62 protein expression in AMPKα knockdown HK‐2 cells. (B) Western blot analysis of AMPK and mTOR phosphorylation, LC3B, and SQSTM1/p62 protein expression in HK‐2 cells treated with Compound C (4 μM) for 72 h. (C) Semiquantitative analysis of AMPK and mTOR phosphorylation, LC3B, and SQSTM1/p62 protein expression (n = 3) in (A). (D) Semiquantitative analysis of AMPK and mTOR phosphorylation, LC3B, and SQSTM1/p62 protein expression (n = 3) in (B). (E) Autophagic flux analysis using mRFP‐GFP‐LC3B fluorescence: Autophagosomes are indicated by yellow puncta, autolysosomes by red puncta, and nuclei stained with DAPI (blue). (F) Quantification of the average number of red dots per cell (n = 3). (G) Western blot analysis of γH2AX and p16INK4a protein expression in AMPKα knockdown HK‐2 cells. (H) Semiquantitative analysis of γH2AX and protein p16INK4a protein expression (n = 3) in (G). (I) Western blot analysis of γH2AX and p16INK4a protein expression in Compound C treated‐HK‐2 cells. (J) Semiquantitative analysis of γH2AX and p16INK4a protein expression (n = 3) in (I). (K) qPCR analysis of p53 and p21 mRNA expression in AMPKα knockdown HK‐2 cells (n = 3). (L) qPCR analysis of p53 and p21 mRNA expression in Compound C treated‐HK‐2 cells (n = 3). ****p < 0.0001, ***p < 0.001, **p < 0.01, *p < 0.05, ns indicated p > 0.05.
FIGURE 6
FIGURE 6
CAV1 directly interacts with CaMKK2 and inhibits the phosphorylation of CaMKK2 and AMPK via a Ca2+‐independent pathway. (A) sh‐CaMKK2‐stable HK‐2 cell line was constructed by transfecting HK‐2 cells with CaMKK2‐shRNA using the lipo3000 reagent with psPAX2 and pMD2.G as helper plasmids. The protein levels of CaMKK2, AMPK, and their phosphorylated forms were analyzed by Western blot. (B) Similarly, the sh‐STK11‐stable HK‐2 cell line was established, and the protein levels of STK11, AMPK, and their phosphorylated forms were assessed by Western blot. (C) Western blot detection of CAMKK2 phosphorylation. (D) Changes in intracellular Ca2+ concentration in HK‐2 cells were detected using the Fluo 4 AM Ca2+ fluorescent probe (4 μM), with Ca2+ indicated in green. (E) Prediction of potential interaction between CAV1 and CaMKK2 proteins using the STRING database. (F) Immunofluorescence co‐staining of CAV1 with CaMKK2 in HK‐2 cell. (G) Co‐IP was performed using a CAVl Flag antibody followed by Western blot analysis with a CaMKK2 HA antibody. (H) Co‐IP was performed using a CaMKK2 HA antibody followed by Western blot analysis with a CAVl Flag antibody. (I) CAV1 expression was upregulated in D‐gal‐induced senescent renal proximal tubular epithelial cells and directly interacted with CaMKK2 to inhibit AMPKα (Thr172) activity through a Ca2+‐independent pathway. This inhibition leads to increased phosphorylation of mTOR, reduced autophagy, and an accumulation of metabolic waste and damaged organelles, ultimately resulting in cellular senescence. Conversely, knockout of CAV1 disrupts these processes, enhances autophagy, and thereby delays cellular senescence. ****p < 0.0001, ***p < 0.001, **p < 0.01, ns indicates p > 0.05.

References

    1. Bolignano, D. , Mattace‐Raso F., Sijbrands E. J., and Zoccali C.. 2014. “The Aging Kidney Revisited: A Systematic Review.” Ageing Research Reviews 14: 65–80. - PubMed
    1. Chen, Z. H. , Cao J. F., Zhou J. S., et al. 2014. “Interaction of Caveolin‐1 With ATG12‐ATG5 System Suppresses Autophagy in Lung Epithelial Cells.” American Journal of Physiology. Lung Cellular and Molecular Physiology 306, no. 11: L1016–L1025. - PMC - PubMed
    1. Cui, J. , Bai X. Y., Shi S., et al. 2012. “Age‐Related Changes in the Function of Autophagy in Rat Kidneys.” Age (Dordrecht, Netherlands) 34, no. 2: 329–339. - PMC - PubMed
    1. Emmerich, F. , Zschiedrich S., Reichenbach‐Braun C., et al. 2021. “Low Pre‐Transplant Caveolin‐1 Serum Concentrations Are Associated With Acute Cellular Tubulointerstitial Rejection in Kidney Transplantation.” Molecules 26, no. 9: 2648. - PMC - PubMed
    1. Forrester, S. J. , Elliott K. J., Kawai T., et al. 2017. “Caveolin‐1 Deletion Prevents Hypertensive Vascular Remodeling Induced by Angiotensin II.” Hypertension 69, no. 1: 79–86. - PMC - PubMed

Substances

LinkOut - more resources