

Cortical Thickness Differences in Autistic Children With and Without Intellectual Disability
- PMID: 39887572
- PMCID: PMC11928918
- DOI: 10.1002/aur.3313
Cortical Thickness Differences in Autistic Children With and Without Intellectual Disability
Abstract
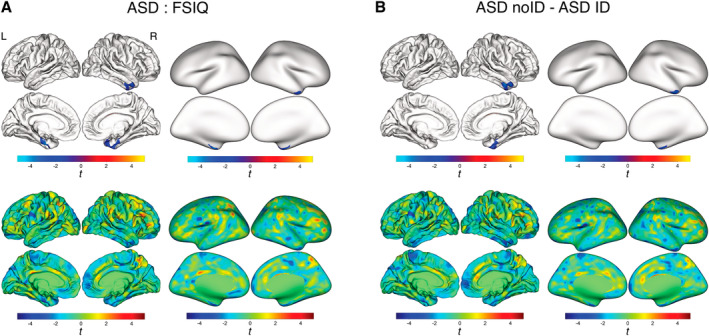
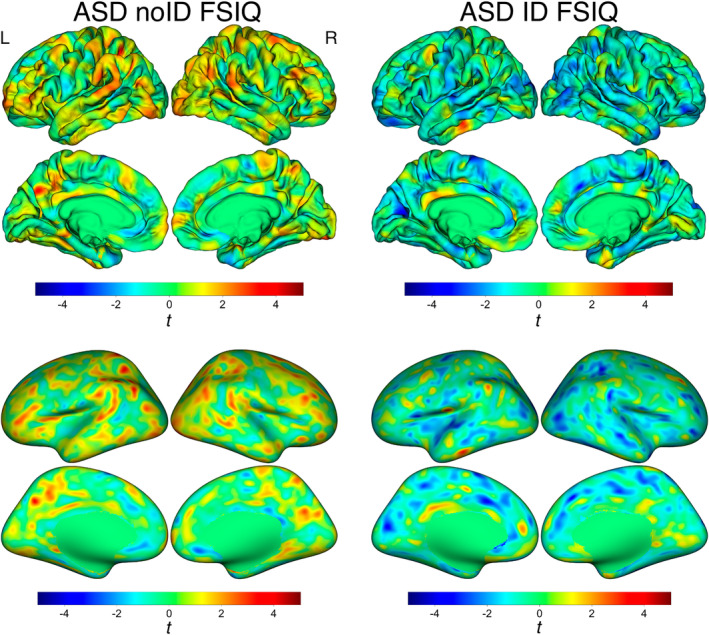
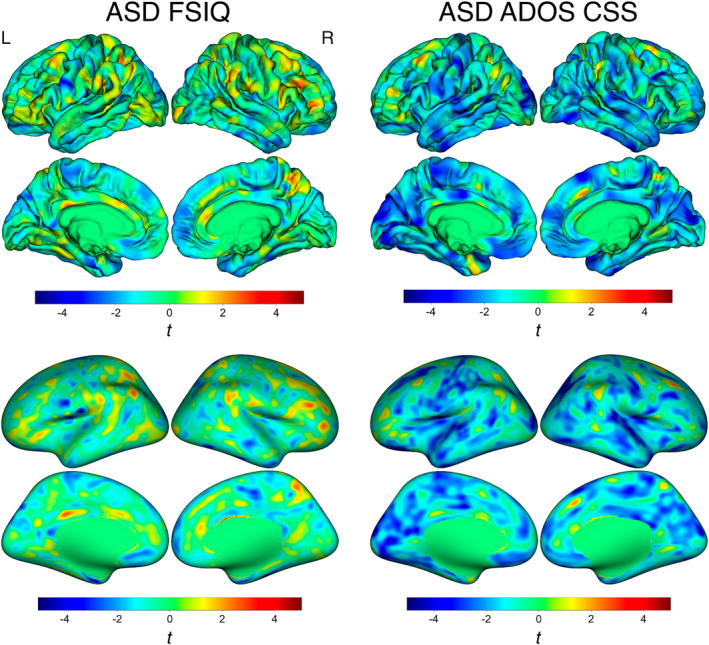
Of the 1 in 36 individuals in the United States who are diagnosed with autism spectrum disorder, nearly 40% also have intellectual disability (ID). The cortex has been widely implicated in neural processes underlying autistic behaviors as well as intellectual ability. Thus, neuroimaging features such as cortical thickness are of particular interest as a possible biomarkers of the condition. However, neuroimaging studies often fail to include autistic individuals with ID. As a result, there are few studies of cortical thickness in autistic individuals across the entire range of intellectual abilities. This study used MRI to evaluate cortical thickness in young autistic children (n = 88, mean age 5.37 years) with a large range of intellectual ability (IQ 19-133) as well as nonautistic, nondevelopmentally delayed (referred to here as typically developing [TD]) peers (n = 53, mean age 5.29 years). We first investigated associations between full scale IQ and cortical thickness in both autistic and TD children. Autistic children had significant negative associations (i.e., thinner cortex, higher IQ) in bilateral entorhinal cortex, right fusiform gyrus, superior, middle and inferior temporal gyri, and right temporal pole that were not present in TD children. Significantly thicker cortex was also observed in these regions for autistic children with ID (i.e., IQ ≤ 70) compared with those without. Last, given the reported correspondence between the severity of autism symptoms and intellectual ability, we compared cortical thickness associations with both IQ and ADOS Calibrated Severity Scores and found these patterns overlapped to a significant degree across the cortex.
Keywords: IQ; MRI; autism; cortical thickness; intellectual disability.
© 2025 The Author(s). Autism Research published by International Society for Autism Research and Wiley Periodicals LLC.
Conflict of interest statement
The authors declare no conflicts of interest.
Figures
References
-
- American Psychiatric Association . 1994. Diagnostic and Statistical Manual of Mental Disorders (DSM‐4®). Washington, DC: American Psychiatric Pub.
-
- American Psychiatric Association . 2013. Diagnostic and Statistical Manual of Mental Disorders (DSM‐5®). Arlington, VA: American Psychiatric Pub.
-
- Bartholomay, K. L. , Jordan T. L., Foland‐Ross L. C., Kendall N., Lightbody A. A., and Reiss A. L.. 2024. “Alterations in Cortical and Subcortical Neuroanatomy and Associations With Behavior in Females With Fragile X Syndrome.” Developmental Medicine and Child Neurology. 10.1111/dmcn.16081. - DOI - PMC - PubMed
