. 2025 Mar;12(12):e2411320.
doi: 10.1002/advs.202411320. Epub 2025 Jan 31.

Redox-Induced Stabilization of AMBRA1 by USP7 Promotes Intestinal Oxidative Stress and Colitis Through Antagonizing DUB3-Mediated NRF2 Deubiquitination

Affiliations

Redox-Induced Stabilization of AMBRA1 by USP7 Promotes Intestinal Oxidative Stress and Colitis Through Antagonizing DUB3-Mediated NRF2 Deubiquitination

Weimin Xu et al. Adv Sci (Weinh). 2025 Mar.

Abstract

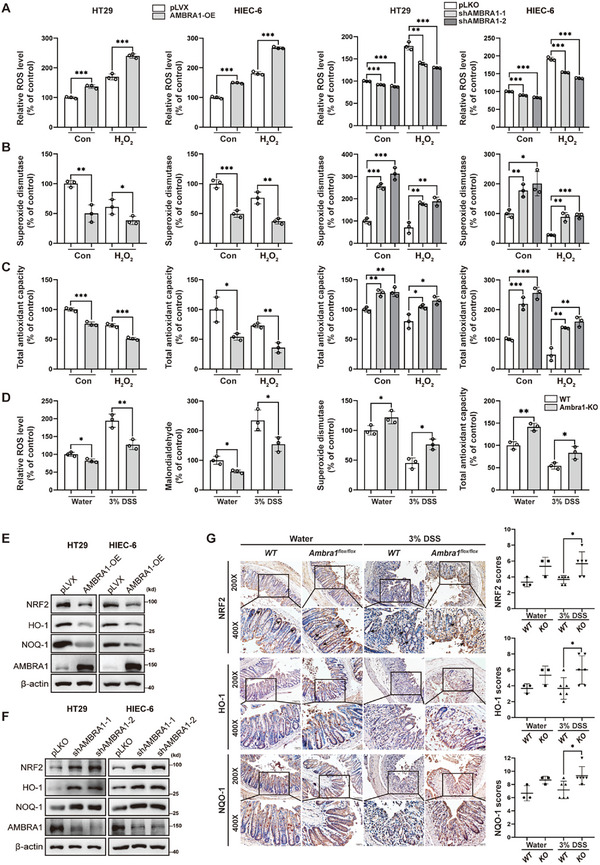
Inflammatory bowel disease (IBD) is associated with oxidative stress and redox signaling disruption. It is recently reported that proautophagic autophagy/beclin-1 regulator 1 (AMBRA1) is a positive modulator of the NF-κB pathway that promotes intestinal inflammation. However, its effect on intestinal redox state and whether AMBRA1 is regulated by oxidative stress remain unknown. In this study, it is found that AMBRA1 functions as a pro-oxidative factor that increases oxidative stress in intestinal epithelial cells (IECs) in vitro and in vivo. Mechanistically, the N-terminal F1 domain is required for AMBRA1 to competitively interact with the N-terminal domain of NRF2, thereby antagonizing the interaction between deubiquitinating protein 3 (DUB3) and NRF2, suppressing DUB3-mediated NRF2 deubiquitination, and leading to NRF2 degradation. In response to H2O2 stimulation, the interaction between AMBRA1 and ubiquitin-specific protease 7 (USP7) is enhanced, facilitating USP7 to deubiquitinate AMBRA1 at K83 and K86 and stabilize AMBRA1. Notably, the USP7 inhibitor, P5091, inhibits oxidative stress and colitis in vivo. Elevated AMBRA1 expression in inflamed colon tissues from ulcerative colitis patients is negatively correlated with decreased NRF2 protein levels. Overall, this study identifies AMBRA1 as a pro-oxidative factor in IECs and provides a redox-modulating therapeutic strategy for targeting USP7/AMBRA1 in IBD.

Keywords: AMBRA1; NRF2; USP7; inflammatory bowel disease; intestinal oxidative stress.


Conflict of interest statement

The authors declare no conflict of interest.

Figures

Figure 1
Figure 1
AMBRA1 enhances intestinal oxidative stress in vitro and in vivo. A–C) The levels of ROS (A), SOD (B) and T‐AOC (C) were measured in AMBRA1‐overexpressing, AMBRA1‐deleted and control HT29, HIEC‐6 cells after treatment with H2O2 (200 µM) for 6 h by using commercially available kits according to the manufacturer's instructions. D) The levels of ROS, MDA, SOD and T‐AOC were measured in intestinal epithelium from in control and DSS‐treated WT and Villin‐Ambra1flox/flox mice by using commercially available kits according to the manufacturer's instructions. DSS‐induced WT and Villin‐Ambra1flox/flox mice were littermate. E,F) Western blot analysis of NRF2 expression in AMBRA1‐overexpressing, AMBRA1‐knockdown and control HT29 and HIEC‐6 cells. G) NRF2, HO‐1 and NQO‐1 expression were examined, evaluated and semiquantitatively scored in colons from control and DSS‐treated WT and Villin‐Ambra1flox/flox mice via immunohistochemistry. The data are presented as the means ± SDs. n = 3 (A–D) biologically independent samples per group. These data (A–C) are representative of 3 independent experiments. n = 3 biologically independent samples for control group, n = 6 biologically independent samples for DSS group G). One‐way ANOVA (A–D) and the Mann‒Whitney's U test (G) were performed to assess statistical significance. * P < 0.05, ** P < 0.01, *** P < 0.001.
Figure 2
Figure 2
AMBRA1 promotes NRF2 degradation via K48‐linked polyubiquitination in a KEAP1‐independent manner. A) Analysis of the half‐life of NRF2 protein in control and AMBRA1‐overexpressing HT29 and HIEC‐6 cells. The cells were treated with cycloheximide (CHX) (75 µg ml−1) for the indicated times before western blot analysis of NRF2 protein levels. B) The protein level of NRF2 was examined by western blotting in HEK293T cells transfected with indicated plasmids and treated with or without MG132 (10 µM) treatment. To enhance the detection of NRF2 protein in this study, 60–80 µg total protein were used for western blot analysis of the NRF2 protein in HEK293T cells. C) The protein levels of NRF2 were measured by western blotting in control and AMBRA1‐overexpressing HT29 and HIEC‐6 cells with or without MG132 (10 µM) treatment. D) HEK293T cells were transfected with HA‐Ub, HA‐Ub‐K48R, HA‐Ub‐K63R, GFP‐NRF2 and MYC‐AMBRA1. GFP‐NRF2 was immunoprecipitated for subsequent detection and quantification of the ubiquitination level via western blotting. E) The control and AMBRA1‐knockdown HEK293T cells were transfected with HA‐Ub, HA‐Ub‐K48R, HA‐Ub‐K63R and GFP‐NRF2. GFP‐NRF2 was immunoprecipitated for subsequent quantification of the ubiquitination level of NRF2 via western blotting. F) HEK293T cells were transfected with control and siRNA targeting KEAP1 and then transfected with the indicated plasmids. Two days after transfection, NRF2 expression was determined via western blotting. G) The control and KEAP1‐knockdown HEK293T cells were transfected with HA‐Ub, MYC‐AMBRA1 and GFP‐NRF2 plasmids. Lysates of the cells were used for immunoprecipitation with an anti‐GFP antibody for subsequent quantification of NRF2 ubiquitination via western blotting. H) HEK293T cells were transfected with the indicated control vector, FLAG‐KEAP1WT, FLAG‐KEAP1C273&C288A and HA‐AMBRA1 plasmids. NRF2 protein levels were measured via western blotting. I) HEK293T cells were transfected with HA‐Ub, FLAG‐KEAP1WT, FLAG‐KEAP1C273&C288A, MYC‐AMBRA1 and GFP‐NRF2 plasmids. The cell lysates were used for immunoprecipitation with an anti‐GFP antibody for subsequent quantification of NRF2 ubiquitination via western blotting. J) HEK293T cells were transfected with the indicated control vector or with the FLAG‐KEAP1 or HA‐AMBRA1 plasmid. NRF2 protein levels were measured via western blotting. K) HEK293T cells were transfected with the indicated HA‐Ub, HA‐Ub‐K48R, GFP‐NRF2, MYC‐AMBRA1 and FLAG‐KEAP1 plasmids. The level of NRF2 ubiquitination was analyzed as described above.
Figure 3
Figure 3
The N‐term F1 domain is required for AMBRA1 to inhibit the DUB3‐mediated NRF2 deubiquitination. A) Endogenous co‐IP of AMBRA1 and NRF2 in HT29 and HIEC‐6 cells. B) Endogenous co‐IP of NRF2 and DUB3 in control and AMBRA1‐overexpressing HT29 cells. C) Exogenous co‐IP of GFP‐NRF2 and HA‐DUB3 in HEK293T cells transfected with control or siRNA targeting AMBRA1. D) HEK293T cells were transfected with the indicated control vector or the indicated FLAG‐DUB3 or HA‐AMBRA1 plasmids. NRF2 expression was measured via western blotting. E) HEK293T cells were transfected with control and siRNA targeting AMBRA1 and indicated control and FLAG‐DUB3 plasmids. NRF2 expression was examined via western blotting. F) HEK293T cells were transfected with control or siRNA targeting DUB3 and the indicated control or HA‐AMBRA1 plasmids. NRF2 expression was measured via western blotting G) HEK293T cells were transfected with the indicated HA‐Ub, HA‐Ub‐K48R, GFP‐NRF2, MYC‐AMBRA1 and FLAG‐DUB3 plasmids. Lysates of the cells were used for immunoprecipitation with an anti‐GFP antibody for subsequent quantification of NRF2 ubiquitination via western blotting. H) The control and AMBRA1‐knockdown HEK293T cells were transfected with HA‐Ub, FLAG‐DUB3 and GFP‐NRF2 plasmids. The cell lysates were used for immunoprecipitation with an anti‐GFP antibody for subsequent quantification of NRF2 ubiquitination via western blotting. I) The control and DUB3‐knockdown HEK293T cells were transfected with HA‐Ub, GFP‐NRF2 and MYC‐AMBRA1 plasmids. The cell lysates were used for immunoprecipitation with an anti‐GFP antibody for subsequent quantification of NRF2 ubiquitination via western blotting. J,K) Exogenous co‐IP of FLAG‐AMBRA1, FLAG‐DUB3 and full‐length/truncated HA‐NRF2 in HEK293T cells. L) Exogenous co‐IP of FLAG‐DUB3 and full‐length HA‐NRF2 and 1–350 truncation of HA‐NRF2 with or without coexpression of MYC‐AMBRA1. M) Exogenous co‐IP of FLAG‐DUB3 and GFP‐NRF2 in HEK293T cells with the co‐transfection of full‐length/truncated HA‐AMBRA1. N) Endogenous co‐IP of NRF2 and DUB3 in pLVX‐vector control, AMBRA1‐overexpressing and F1 domain‐overexpressing HIEC‐6 cells. O) HEK293T cells were transfected with the indicated control, full‐length and the F1 fragment of HA‐AMBRA1 plasmids. The total protein levels of NRF2, HO‐1 and NQO‐1 and the nuclear expression level of NRF2 were determined via western blotting. P) The protein levels of NRF2 were measured in HEK293T cells transfected with control, full‐length/F1 fragment HA‐AMBRA1 and treated with or without MG132 (10 µM) via western blotting. Q) HEK293T cells were transfected with the indicated HA‐Ub, GFP‐NRF2, FLAG‐AMBRA1 and FLAG‐AMBRA1‐F1 fragment plasmids. Lysates of the cells were used for immunoprecipitation with an anti‐GFP antibody for subsequent quantification of NRF2 ubiquitination via western blotting.
Figure 4
Figure 4
USP7 stabilizes the AMBRA1 protein. A) Endogenous co‐IP of AMBRA1 and USP7 in HT29 and HIEC‐6 cells. B) Western blot analysis of AMBRA1 expression in USP7‐knockdown and USP7‐overexpressing HT29 and HIEC‐6 cells. C) Analysis of the half‐life of the AMBRA1 protein in control and USP7‐knockdown HT29 and HIEC‐6 cells. The cells were treated with cycloheximide (CHX) (75 µg ml−1) for the indicated times prior to western blot analysis of AMBRA1 expression. D) The protein levels of AMBRA1 were measured in control and USP7‐knockdown HT29 and HIEC‐6 cells with or without MG132 (10 µM) treatment via western blotting. E) HEK293T cells were transfected with HA‐Ub, HA‐Ub‐K48R, HA‐Ub‐K63R, FLAG‐AMBRA1 and MYC‐USP7. Cell lysates were used for immunoprecipitation of FLAG‐AMBRA1 and subsequent quantification of the ubiquitination level via western blotting. F) The control and USP7‐knockdown HEK293T cells were transfected with HA‐Ub, HA‐Ub‐K48R, HA‐Ub‐K63R and FLAG‐AMBRA1. FLAG‐AMBRA1 was immunoprecipitated for subsequent quantification of the ubiquitination level of AMBRA1 via western blotting. G) HEK293T cells were transfected with HA‐Ub, FLAG‐AMBRA1 WT, Δ1‐50, Δ60‐180, Δ760‐980 and MYC‐USP7. Cell lysates were used for immunoprecipitation of FLAG‐AMBRA1 and subsequent quantification of the ubiquitination level via western blotting. H) HEK293T cells were transfected with HA‐Ub, FLAG‐AMBRA1WT, FLAG‐AMBRA1K83R, FLAG‐AMBRA1K86R, FLAG‐AMBRA1K175R and MYC‐USP7. Cell lysates were used for immunoprecipitation of FLAG‐AMBRA1 and subsequent quantification of the ubiquitination level via western blotting. I) HEK293T cells were transfected with HA‐Ub, FLAG‐AMBRA1WT, FLAG‐AMBRA1K83R+86R and MYC‐USP7. The ubiquitination level was analyzed as described above. J) Analysis of the half‐life of the WT and K83R+86R mutant FLAG‐AMBRA1 in HEK293T cells transfected with control and MYC‐USP7 plasmids. Cells were treated with CHX (75 µg ml−1) for the indicated times before western blot analysis. K) The protein levels of the WT and K83R+86R mutant FLAG‐AMBRA1 were measured via western blotting in HEK293T cells transfected with control and MYC‐USP7 plasmids with or without MG132 (10 µM) treatment.
Figure 5
Figure 5
H2O2 stimulation increases AMBRA1 protein levels in IECs. A) qRT‒PCR analysis of AMBRA1 mRNA levels in HT29 and HIEC‐6 cells treated with H2O2 (50, 100, 200 or 400 µM) for 6 h. B) Western blot analysis of AMBRA1 expression in HT29 and HIEC‐6 cells treated with H2O2 (50, 100, 200 or 400 µM) for 6 h. C) Western blot analysis of AMBRA1 expression in HT29 and HIEC‐6 cells treated with H2O2 (200 µM) for the indicated times. D) Analysis of the half‐life of AMBRA1 protein in HT29 cells with or without H2O2 (200 µM) treatment. The cells were treated with CHX (75 µg ml−1) for the indicated times before western blot analysis of AMBRA1 expression. E) Western blot analysis of AMBRA1 expression in HT29 and HIEC‐6 cells treated with H2O2 (200 µM) alone or in combination with P5091 (10 µM) for the indicated times. F) Western blot analysis of AMBRA1 expression in USP7‐knockdown and control HT29 and HIEC‐6 cells treated with H2O2 (200 µM). G) HEK293T cells were transfected with the HA‐Ub, HA‐Ub‐K48R, HA‐Ub‐K63R, FLAG‐AMBRA1 plasmids and treated with or without H2O2 (200 µM). The cell lysates were used for immunoprecipitation with an anti‐FLAG antibody for subsequent quantification of AMBRA1 ubiquitination via western blotting. H) The control and USP7‐knockdown HEK293T cells were transfected with HA‐Ub, FLAG‐AMBRA1 plasmids and treated with or without H2O2 (200 µM). The cell lysates were used for immunoprecipitation with an anti‐ FLAG antibody for subsequent quantification of AMBRA1 ubiquitination via western blotting. I) HEK293T cells were transfected with the HA‐Ub, FLAG‐AMBRA1 plasmids and treated with H2O2 (200 µM) alone or in combination with P5091 (10 µM). The ubiquitination level of AMBRA1 was analyzed as described above. J) Exogenous co‐IP of FLAG‐AMBRA1 and HA‐USP7, FLAG‐USP7 and HA‐AMBRA1 in HEK293T cells treated with or without H2O2 stimulation (200 µM). K) Semi‐endogenous co‐IP of exogenous FLAG‐AMBRA1 and FLAG‐USP7 and endogenous USP7 and AMBRA1 in HEK293T cells treated with or without H2O2 stimulation (200 µM). L) Endogenous co‐IP of AMBRA1 and USP7 in HT29 and HIEC‐6 cells with or without H2O2 stimulation (200 µM). M) In situ PLA (red foci) analysis of the interaction between AMBRA1 and USP7 in H2O2‐treated (200 µM) and control HT29 cells. Scale bars, 10 µm. The data are presented as the means ± SDs. n = 3 (A) biologically independent samples per group. These data (A, M) are representative of 2 independent experiments. n = 5 (M) technical replicates per group. One‐way ANOVA (A) and students’ t test (M) were performed to assess statistical significance. *** P < 0.001.
Figure 6
Figure 6
USP7 inhibitor P5091 diminishes oxidative stress and attenuates DSS‐induced colitis in vivo. A) Schematic diagram of the P5091 treatment in the DSS‐induced acute colitis model. C57BL/6 mice were administered 3% DSS and treated with or without P5091 (20 mg k−1g) on Day 2, 4, and 6 during colitis induction (n = 3 for control group, n = 5 for DSS‐treated group). B,C) Representative images and statistical analysis of the colorectum lengths and spleen weights of control and P5091‐treated mice. D) The loss of body weight and the severity of diarrhoea and bleeding, as evaluated by the DAI score, were determined in control and DSS‐induced mice with or without P5091 treatment. E) The levels of oxidative stress markers (ROS, T‐AOC, SOD and MDA) were examined in colon tissues from control and DSS‐induced mice with or without P5091 treatment. F) The pathological scores of colons from control and DSS‐induced mice with or without P5091 treatment were evaluated via hematoxylin–eosin staining (magnification: upper panels, 200×; lower panels, 400×). G) The expression of NRF2, AMBRA1 and USP7 were examined in control and P5091‐treated mice via immunohistochemistry. The data are presented as the means ± SDs. n = 3 biologically independent samples for control group, n = 5 biologically independent samples for DSS group (B–D, F, G). n = 3 (E) biologically independent samples per group. One‐way ANOVA (B, C, E), two‐way ANOVA (D) and the Mann‒Whitney's U test (F, G) were performed to assess statistical significance. * P < 0.05, ** P < 0.01, *** P < 0.001.
Figure 7
Figure 7
AMBRA1 is highly expressed in inflamed colon, and its expression is negatively correlated with that of NRF2. A) AMBRA1, NRF2, HO‐1 and NQO‐1 expression levels were examined in inflamed and paired adjacent non‐inflamed colon tissues from UC patients via western blotting (n = 12). B–E) AMBRA1 (B), NRF2 (C), HO‐1 (D) and NQO‐1 (E) protein levels were examined in inflamed and paired adjacent non‐inflamed colon tissues from UC patients via immunohistochemistry (n = 15). F) Spearman's correlation analysis was used to evaluate the correlations between the protein level of AMBRA1 and the levels of NRF2, HO‐1 and NQO‐1 in inflamed colon tissues from patients with UC. The data are presented as the means ± SDs. n = 12 (A), n = 15 (B–F) biologically independent samples per group. The Wilcoxon signed‐rank test (B‐E) and Spearman's correlation analysis (F) were performed to assess statistical significance. **P < 0.01.
Figure 8
Figure 8
Schematic diagram illustrating the findings of this study. The deubiquitinase USP7 interacts with AMBRA1 and deubiquitinates it at K83/K86, thereby stabilizing the AMBRA1 protein. H2O2 stimulation promotes the interaction between AMBRA1 and USP7, thereby enhancing the deubiquitination and stabilization of AMBRA1 by USP7 in IECs under oxidative stress conditions. The F1 domain of AMBRA1 competitively inhibits the binding of DUB3 to the N‐terminal 1–350 domain of NRF2, leading to abrogated deubiquitination of NRF2 by DUB3, increased NRF2 degradation and subsequent decreased expression of HO‐1 and NQO‐1; these effects further promote intestinal oxidative stress and aggravate intestinal inflammation.

References

    1. Gros B., Kaplan G. G., JAMA, J. Am. Med. Assoc. 2023, 330, 951. - PubMed
    1. Roda G., Chien Ng S., Kotze P. G., Argollo M., Panaccione R., Spinelli A., Kaser A., Peyrin‐Biroulet L., Danese S., Nat. Rev. Dis. Primers 2020, 6, 22. - PubMed
    1. Kobayashi T., Siegmund B., Le Berre C., Wei S. C., Ferrante M., Shen B., Bernstein C. N., Danese S., Peyrin‐Biroulet L., Hibi T., Nat. Rev. Dis. Primers 2020, 6, 74. - PubMed
    1. Kobayashi T., Hibi T., Nat. Rev. Gastroenterol. Hepatol. 2023, 20, 79. - PMC - PubMed
    1. Sparrow M. P., Papamichael K., Ward M. G., Riviere P., Laharie D., Paul S., Roblin X., J. Crohns. Colitis 2020, 14, 542. - PMC - PubMed

Substances

LinkOut - more resources