. 2025 Mar;12(11):e2415882.
doi: 10.1002/advs.202415882. Epub 2025 Jan 30.

Multifunctional Fluorescent Probe for Simultaneous Detection of ATP, Cys, Hcy, and GSH: Advancing Insights into Epilepsy and Liver Injury

Affiliations

Multifunctional Fluorescent Probe for Simultaneous Detection of ATP, Cys, Hcy, and GSH: Advancing Insights into Epilepsy and Liver Injury

Ting Yu et al. Adv Sci (Weinh). 2025 Mar.

Abstract

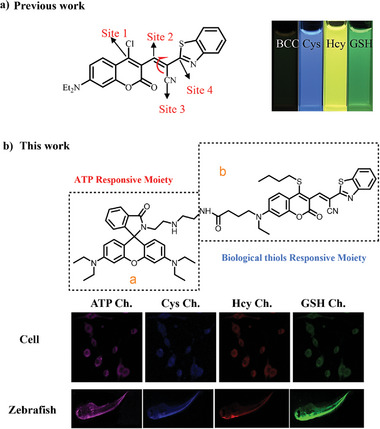
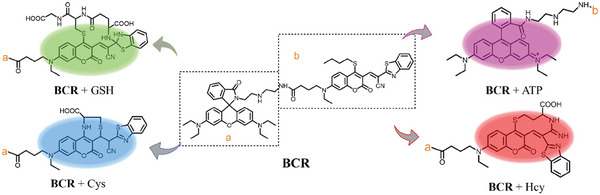
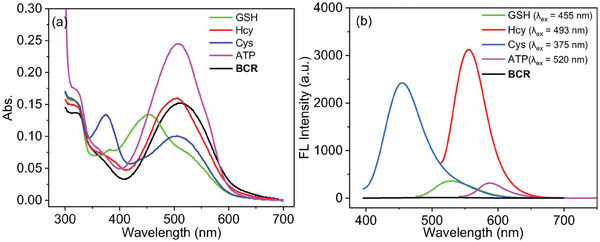
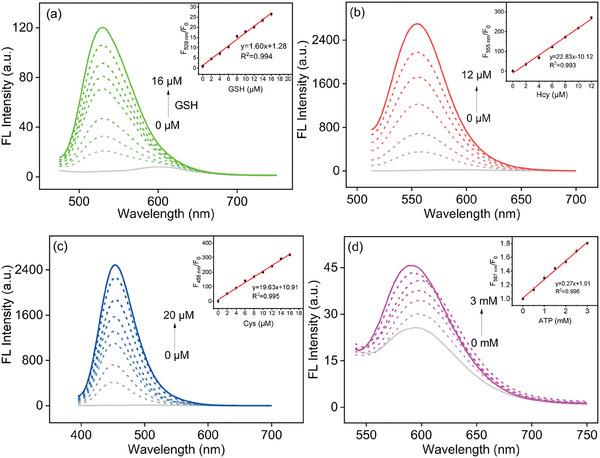
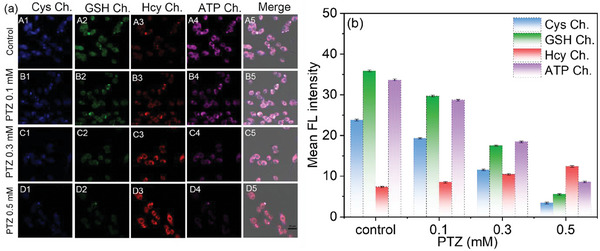
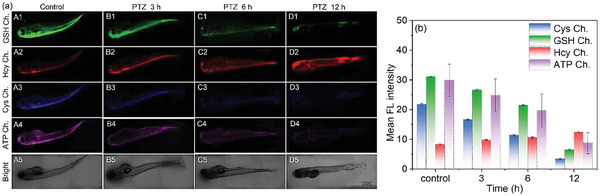
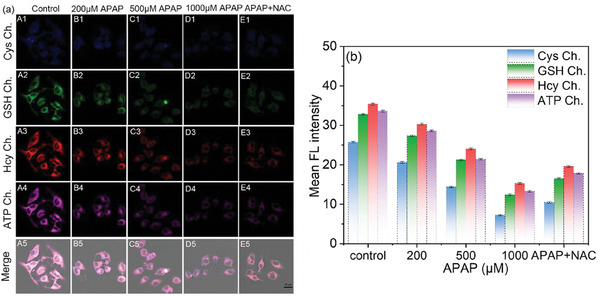
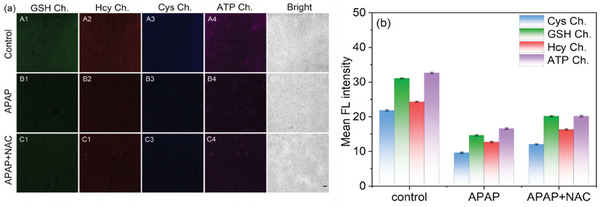
Adenosine triphosphate (ATP) is a critical intracellular energy currency that plays a key role in various cellular processes and is closely associated with numerous diseases. Similarly, biothiols such as glutathione (GSH), cysteine (Cys), and homocysteine (Hcy) are integral to many physiological and pathological processes due to their strong redox properties. Simultaneous discrimination and detection of ATP and biothiols offer valuable insights into the pathogenesis of conditions such as epilepsy and liver injury. This study introduces the first fluorescent probe, BCR, designed for multifunctional detection of ATP, GSH, Hcy, and Cys. With outstanding optical properties, excellent biocompatibility, high selectivity, and superior sensitivity, probe BCR enables effective imaging of ATP and biothiol dynamics in vivo. Moreover, probe BCR successfully visualizes changes in ATP, GSH, Hcy, and Cys levels in a PTZ-induced epileptic zebrafish model and an APAP-induced mouse liver injury tissue section model. These findings underscore the significant potential of probe BCR for early disease diagnosis and therapeutic applications.

Keywords: adenosine triphosphate; biothiols; fluorescent probe; simultaneous sensing.


Conflict of interest statement

The authors declare no conflict of interest.

Figures

Scheme 1
Scheme 1
a) Previous work for the simultaneous sensing of Cys, Hcy, and GSH, b) Structure of probe BCR and its application. [Correction added on 10 February 2025, after first online publication: Scheme 1 image updated.]
Scheme 2
Scheme 2
Proposed sensing mechanisms of probe BCR for ATP and biothiols.
Figure 1
Figure 1
a) Absorption spectra, b) fluorescence spectra of probe BCR (10 µm) upon addition of GSH/Hcy/Cys (100 µm), ATP (10 mm) at room temperature for 30 min.
Figure 2
Figure 2
Fluorescence spectra of probe BCR solution after adding different concentrations of c) GSH (0–16 µm), d) Hcy (0–12 µm), e) Cys (0–20 µm) and f) ATP (0–3 mm). Conditions: λex = 455 nm for GSH, λex = 493 nm for Hcy, λex = 375 nm for Cys, λex = 520 nm for ATP, slit (nm): GSH: 2.5/5; Hcy: 2.5/5; Cys: 5/5; ATP: 2.5/5.
Figure 3
Figure 3
a) Confocal fluorescence imaging of GSH, Hcy, Cys, and ATP in SH‐SY5Y cells. Cells were incubated with a probe (5 µm) for 30 min (A1–A5). The cells were pretreated with PTZ (0.1 mmol l−1) (B1‐B5), PTZ (0.3 mmol l−1) (C1–C5) and PTZ (0.5 mmol l−1) (D1‐D5) for 12 h, and incubated with probe (5 µm) for 30 min. b) Relative pixel intensity of the fluorescence images A1–D5 in (a). λ ex = 405 nm, λ em = 420–470 nm for the blue channel, λ ex = 458 nm, λ em = 500–560 nm for the green channel, and λ ex = 488 nm, λ em = 540–630 nm for the red channel, and λ ex = 514 nm, λ em = 580–650 nm for the purple channel. Scale: 25 µm.
Figure 4
Figure 4
a) Confocal fluorescence imaging of GSH, Hcy, Cys, and ATP in Zebrafish. Probe BCR (5 µm) was incubated with zebrafish for 45 min (A1–A5), and added (6 mm) PTZ, and incubated with zebrafish for 3 h (B1–B5), 6 h (C1–C5), and 12 h (D1–D5), respectively. b) The relative pixel intensity of the images in different groups corresponding to (a). Scale: 200 µm.
Figure 5
Figure 5
a) Confocal fluorescence imaging of GSH, Hcy, Cys, and ATP in HepG2 cells. Cells were incubated with different concentrations of APAP (0, 200,500, and 1000 µm), and APAP (1000 µm) + NAC (400 µm) for 12 h. b) Relative pixel intensity of the fluorescence images A1‐E5 in (a). λ ex = 405 nm, λ em = 420–470 nm for the blue channel, λ ex = 458 nm, λ em = 500–560 nm for the green channel, and λ ex = 488 nm, λ em = 540–630 nm for the red channel, and λ ex = 514 nm, λ em = 580–650 nm for the pink channel. Scale: 25 µm.
Figure 6
Figure 6
a) Confocal fluorescence imaging of GSH, Hcy, Cys, and ATP in mouse liver tissue with injury. Liver tissues were incubated with probe BCR (5 µm) for 45 min. b) The relative pixel intensity of the images in different groups corresponding to (a). Scale: 200 µm.

Similar articles

References

    1. Chen H., Zhang Y.‐H. P. J., Crit. Rev. Biotechnol. 2021, 41, 1826403. - PubMed
    1. Jun Y. W., Wang T., Hwang S., Kim D., Ma D., Kim K. H., Kim S., Jung J., Ahn K. H., Angew. Chem., Int. Ed. 2018, 57, 10142. - PubMed
    1. Fang Y., Shi W., Hu Y., Li X., Ma H., Chem. Commun. 2018, 54, 5454. - PubMed
    1. Fortibui M. M., Yoon S. A., Yoo S. Y., Son J. Y., Lee M. H., Coord. Chem. Rev. 2024, 510, 215800.
    1. Seino S., Miki T., Prog. Biophys. Mol. Biol. 2003, 81, 133. - PubMed