

Hybrid transformer-based model for mammogram classification by integrating prior and current images
- PMID: 39887755
- PMCID: PMC12082763
- DOI: 10.1002/mp.17650
Hybrid transformer-based model for mammogram classification by integrating prior and current images
Abstract
Background: Breast cancer screening via mammography plays a crucial role in early detection, significantly impacting women's health outcomes worldwide. However, the manual analysis of mammographic images is time-consuming and requires specialized expertise, presenting substantial challenges in medical practice.
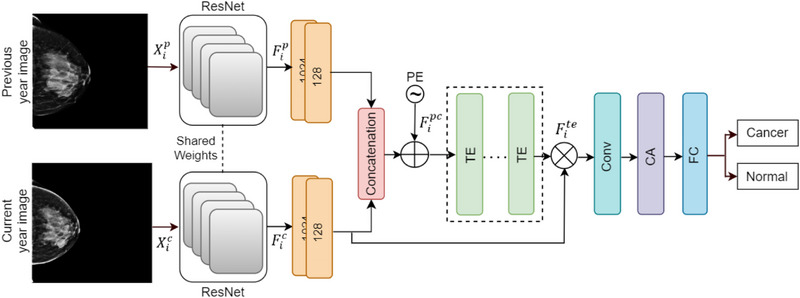
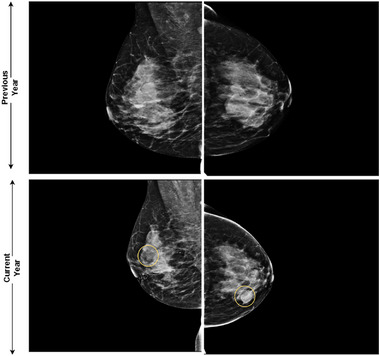
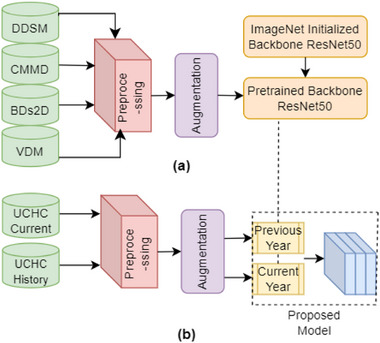
Purpose: To address these challenges, we introduce a CNN-Transformer based model tailored for breast cancer classification through mammographic analysis. This model leverages both prior and current images to monitor temporal changes, aiming to enhance the efficiency and accuracy (ACC) of computer-aided diagnosis systems by mimicking the detailed examination process of radiologists.
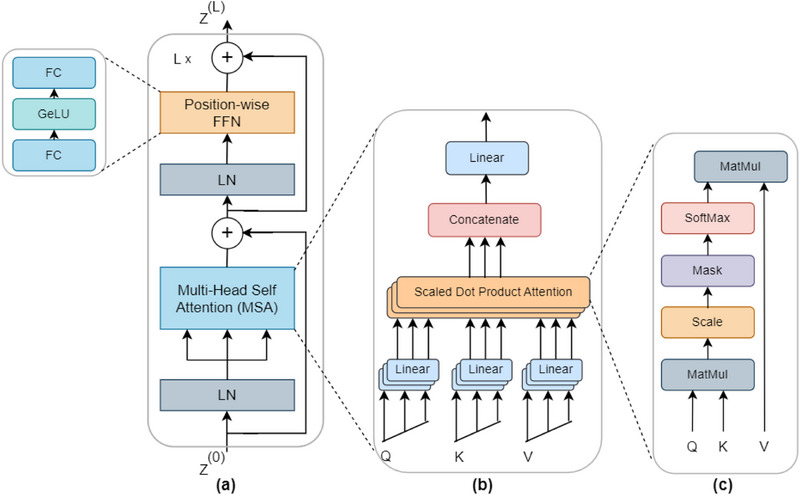
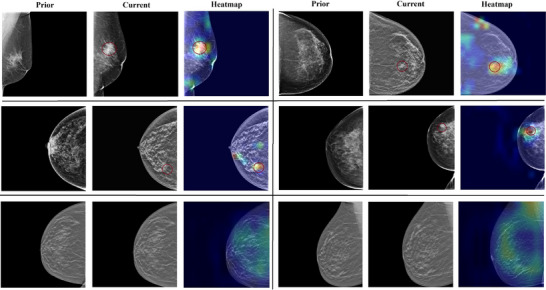
Methods: In this study, our proposed model incorporates a novel integration of a position-wise feedforward network and multi-head self-attention, enabling it to detect abnormal or cancerous changes in mammograms over time. Additionally, the model employs positional encoding and channel attention methods to accurately highlight critical spatial features, thus precisely differentiating between normal and cancerous tissues. Our methodology utilizes focal loss (FL) to precisely address challenging instances that are difficult to classify, reducing false negatives and false positives to improve diagnostic ACC.
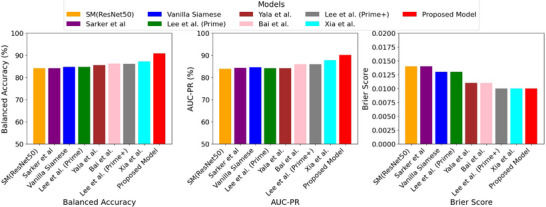
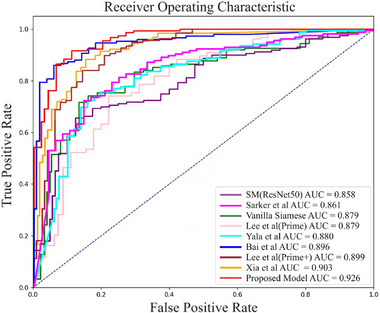
Results: We compared our model with eight baseline models; specifically, we utilized only current images for the single model ResNet50 while employing both prior and current images for the remaining models in terms of accuracy (ACC), sensitivity (SEN), precision (PRE), specificity (SPE), F1 score, and area under the curve (AUC). The results demonstrate that the proposed model outperforms the baseline models, achieving an ACC of 90.80%, SEN of 90.80%, PRE of 90.80%, SPE of 90.88%, an F1 score of 90.95%, and an AUC of 92.58%. The codes and related information are available at https://github.com/NabaviLab/PCTM.
Conclusions: Our proposed CNN-Transformer model integrates both prior and current images, removes long-range dependencies, and enhances its capability for nuanced classification. The application of FL reduces false positive rate (FPR) and false negative rates (FNR), improving both SEN and SPE. Furthermore, the model achieves the lowest false discovery rate and FNR across various abnormalities, including masses, calcification, and architectural distortions (ADs). These low error rates highlight the model's reliability and underscore its potential to improve early breast cancer detection in clinical practice.
Keywords: CNN; prior and current mammograms; transformer.
© 2025 American Association of Physicists in Medicine.
Conflict of interest statement
The authors declare no conflicts of interest.
Figures

Similar articles
-
ViT-MAENB7: An innovative breast cancer diagnosis model from 3D mammograms using advanced segmentation and classification process.Comput Methods Programs Biomed. 2024 Dec;257:108373. doi: 10.1016/j.cmpb.2024.108373. Epub 2024 Aug 23. Comput Methods Programs Biomed. 2024. PMID: 39276667
-
Feature fusion Siamese network for breast cancer detection comparing current and prior mammograms.Med Phys. 2022 Jun;49(6):3654-3669. doi: 10.1002/mp.15598. Epub 2022 Apr 22. Med Phys. 2022. PMID: 35271746
-
Enhanced Pneumonia Detection in Chest X-Rays Using Hybrid Convolutional and Vision Transformer Networks.Curr Med Imaging. 2025;21:e15734056326685. doi: 10.2174/0115734056326685250101113959. Curr Med Imaging. 2025. PMID: 39806960
-
Digital Breast Tomosynthesis with Hologic 3D Mammography Selenia Dimensions System for Use in Breast Cancer Screening: A Single Technology Assessment [Internet].Oslo, Norway: Knowledge Centre for the Health Services at The Norwegian Institute of Public Health (NIPH); 2017 Sep 4. Report from the Norwegian Institute of Public Health No. 2017-08. Oslo, Norway: Knowledge Centre for the Health Services at The Norwegian Institute of Public Health (NIPH); 2017 Sep 4. Report from the Norwegian Institute of Public Health No. 2017-08. PMID: 29553669 Free Books & Documents. Review.
-
Deep Learning Computer-Aided Diagnosis for Breast Lesion in Digital Mammogram.Adv Exp Med Biol. 2020;1213:59-72. doi: 10.1007/978-3-030-33128-3_4. Adv Exp Med Biol. 2020. PMID: 32030663 Review.
References
-
- Siegel RL, Miller KD, Fuchs HE, Jemal A. Cancer statistics, 2022. CA: Cancer Journal Clin. 2022;72:7‐33. - PubMed
-
- Chen W, Zheng R, Zhang S, et al. Cancer incidence and mortality in China, 2013. Cancer Lett. 2017;401:63‐71. - PubMed
-
- Heer E, Harper A, Escandor N, Sung H, McCormack V, Fidler‐Benaoudia MM. Global burden and trends in premenopausal and postmenopausal breast cancer: a population‐based study. Lancet Global Health. 2020;8:e1027‐e1037. - PubMed
-
- Nickson C, Mason KE, English DR, Kavanagh AM. Mammographic screening and breast cancer mortality: a case–control study and meta‐analysis. Cancer Epidemiol Biomarkers Prev. 2012;21:1479‐1488. - PubMed
MeSH terms
Grants and funding
LinkOut - more resources
Full Text Sources
Medical
