. 2025 Apr;12(13):e2414547.
doi: 10.1002/advs.202414547. Epub 2025 Jan 30.

Maladaptive Peripheral Ketogenesis in Schwann Cells Mediated by CB1R Contributes to Diabetic Neuropathy

Affiliations

Maladaptive Peripheral Ketogenesis in Schwann Cells Mediated by CB1R Contributes to Diabetic Neuropathy

Weizhen Li et al. Adv Sci (Weinh). 2025 Apr.

Abstract

Diabetic peripheral neuropathy (DPN) is the most common complication of diabetes. Although studies have previously investigated metabolic disruptions in the peripheral nervous system (PNS), the exact metabolic mechanisms underlying DPN remain largely unknown. Herein, a specific form of metabolic remodeling involving aberrant ketogenesis within Schwann cells (SCs) in streptozotocin (STZ)-induced type I diabetes mellitus is identified. The PNS adapts poorly to such aberrant ketogenesis, resulting in disrupted energy metabolism, mitochondrial damage, and homeostatic decompensation, ultimately contributing to DPN. Additionally, the maladaptive peripheral ketogenesis is highly dependent on the cannabinoid type-1 receptor (CB1R)-Hmgcs2 axis. Silencing CB1R reprogrammed the metabolism of SCs by blocking maladaptive ketogenesis, resulting in rebalanced energy metabolism, reduced histopathological changes, and improved neuropathic symptoms. Moreover, this metabolic reprogramming can be induced pharmacologically using JD5037, a peripheral CB1R blocker. These findings revealed a new metabolic mechanism underlying DPN, and promoted CB1R as a promising therapeutic target for DPN.

Keywords: cannabinoid type 1 receptor; diabetic peripheral neuropathy; ketogenesis; metabolic reprogramming; schwann cell.


Conflict of interest statement

The authors declare no conflict of interest.

Figures
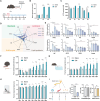
Figure 1
Figure 1
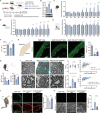
DM‐induced dramatic metabolic remodeling in SCs. A) Schematic presentation of the timeline of STZ injection, behavioral tests, and metabolic evaluations. B) Blood glucose levels were measured one week after STZ injection and before the final sacrifice. n = 6 per group. C) ATP content of the sciatic nerve and its terminals. n = 3 per group. D,E) Summary D) and detailed diagram E) illustrating multiple crucial genes involved in glycolysis, lipolysis, fatty acid synthesis, and the TCA cycle, as evaluated by real‐time PCR. β‐actin was used as a loading control. The BL expression level was standardized to 1 (D). n = 3 per group. F–H) Behavioral tests of DM mice, including the von Frey F), tail‐flick G), and hot plate H) tests. n = 6 per group. I) Intracellular ATP evaluation of three major cellular components of the PNS, DRG neurons, endotheliocytes, and Schwann cells, cultured in standard DMEM (control) or HG (75 mM) for 24h. n = 3 per group. All data are expressed as mean ± SEM. Each data point represents an individual mouse. Statistical comparisons were conducted with two‐way ANOVA followed by Bonferroni's post hoc test (B, C, F‐H); one‐way ANOVA followed by Tukey's post hoc test (E); and two‐tailed t‐test (I). *P < 0.05, **P < 0.01, ***P < 0.001 and ****P < 0.0001.
Figure 2
Figure 2
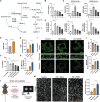
SC‐CB1R knockout attenuates DPN. A) Schematic representation of the preparation of transgenic mice, experimental timeline, and grouping information. B) Western blot and quantification of CB1R in the sciatic nerves with β‐actin used as a loading control. n = 3 per group. C–E) Behavioral tests, including the von Frey C), tail‐flick D), and hot plate E) tests. n = 6 per group. F) ATP content of the sciatic nerve at 4 months post‐STZ injection. n = 3 per group. G) Quantification of motor and sensory nerve conduction velocities at 4 months post‐STZ injection. n = 4 per group. H) Representative images and quantification of PGP 9.5‐labeled intraepidermal nerve fibers in the hind paws at 4 months post‐STZ injection. Scale bar, 50 µm. n = 15 slices from 5 mice. I) Representative electron micrographs and quantification of the myelin sheaths at 4 months post‐STZ injection. Abnormal myelin sheaths are indicated in viridis. Scale bar, 5 µm (top), 2 µm (bottom). For the g‐ratio, each data point indicates an individual myelin sheath. n = 9 slices from 3 mice. J) Representative images and quantification of the CTB traced DRG neurons at 4 months post‐STZ injection. n = 9 slices from 3 mice. Scale bar,100 µm. K) Representative images and quantification of the ATF3 staining in the affected DRGs at 4 months post‐STZ injection. n = 9 slices from 3 mice. Scale bar, 50 µm. All data are expressed as mean ± SEM. Each data point represents an individual mouse B–G). Statistical comparisons were conducted with one‐way ANOVA followed by Tukey's post hoc test B,F–K); and two‐way ANOVA followed by Bonferroni's post hoc test (C‐E). *P < 0.05, **P < 0.01, ***P < 0.001 and ****P < 0.0001.
Figure 3
Figure 3
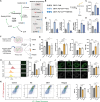
Hmgcs2 is a key downstream target of SC‐CB1R. A) Schematic workflow and grouping details for the quantitative proteomic analysis of the sciatic nerve at 2 months post‐STZ injection. Grouping details: CB1Rfl Naïve (CB1Rfl/fl + TAM); CB1Rfl DM (CB1Rfl/fl; PLP‐CreERT2 + STZ); and CB1RcKO DM (CB1Rfl/fl; PLP‐CreERT2 + TAM + STZ). n = 3 per group. B,C) Heatmap B) and volcano map C) of differential proteins between CB1RcKO DM mice and CB1Rfl DM mice. D) GO analysis of the differential proteins between the CB1RcKO DM and CB1Rfl DM groups. E) Expression pattern of 20 proteins in Cluster 8 identified through Mfuzz analysis. F) GO analysis of proteins in Cluster 8. G) Intersection of differential proteins between the CB1RcKO DM and CB1Rfl DM groups within Cluster 8. H) Western blot analyses and quantifications of Hmgcs2 protein abundance in the sciatic nerves of the 3 groups. n = 3 per group. I) Western blot analyses and quantifications of Hmgcs2 protein abundance in the primary SCs transfected with siRNAs for 72 h, and treated with HG for 24h. Grouping details: standard DMEM (Control), negative siRNA + HG (HG), and CB1R siRNA + HG (si‐CB1R). n = 3 per group. J) Western blot analyses and quantifications of CB1R protein abundance in the primary SCs transfected with siRNAs for 72 h and treated with HG for 24 h. Grouping details: standard DMEM (Control), negative siRNA + HG (HG), and Hmgcs2 siRNA + HG (si‐Hmgcs2). n = 3 per group. All data are expressed as mean ± SEM. Statistical comparisons were conducted with one‐way ANOVA followed by Tukey's post hoc test. *P < 0.05, and **P < 0.01.
Figure 4
Figure 4
Maladaptive ketogenesis in SCs contributes to DPN. A) Metabolic diagram illustrating the diversion of acetyl‐CoA caused by aberrant ketogenesis during DM‐induced SC metabolic remodeling. B) ELISA for acetyl‐CoA in the sciatic nerve lysates at different time points after DM. n = 3 per group. C) βOHB levels in the sciatic nerve lysates and blood serum. n = 3 per group. D) Real‐time PCR analysis of key genes involved in ketogenesis in the sciatic nerve and its terminals. β‐actin was used as a loading control. n = 3 per group. E) Intracellular βOHB levels in primary SCs treated with or without HG for 24h. n = 3 per group. F) The cell viability of SCs treated with varying concentrations of βOHB for 24 h was assessed by CCK‐8 assay. n = 3 per group. G–K) Intracellular ROS G), mitochondrial membrane potential H), representative images of mitochondrial morphology I), quantification of mitochondrial aspect ratio J), and mitochondrial ROS K) in primary SCs. Scale bar, 10 µm. n = 9 G,K), 6 H), and 3 I,J) per group. Each data point indicates a single mitochondrion (J). L) Schematic of the ex vivo investigation of isolated sciatic nerve explants. M) Representative images of immunostaining for S100β in the sciatic nerve explants, with quantification of the abnormal myelin ratio. Orange arrows indicate abnormal myelin sheaths. Scale bar, 20 µm. n = 9 slices from 3 mice. All data are expressed as mean ± SEM. Statistical comparisons were conducted with one‐way ANOVA followed by Tukey's post hoc test (B‐D, F‐H, J, K, M); and two‐tailed t‐test (E). *P < 0.05, **P < 0.01, ***P < 0.001 and ****P < 0.0001.
Figure 5
Figure 5
CB1R inhibition blocks aberrant ketogenesis, and prevents mitochondrial dysfunction. A) Metabolic diagram illustrating the SC metabolic reprogramming induced by CB1R silencing. B) Schematic and grouping details of the evaluations of a series of indicators related to ketogenesis. C) βOHB levels in the sciatic nerves. n = 3 per group. D) Levels of 3 key enzymes involved in ketogenesis in the sciatic nerves. n = 3 per group. E) Levels of acetyl‐CoA in the sciatic nerves. n = 3 per group. F) Schematic and grouping of the in vitro experiment using primary SCs. G) Levels of intracellular metabolites and substrates (intracellular βOHB, acetyl CoA, mitochondrial citric acid, and ATP respectively) of the SCs. n = 3 per group. H) Flow cytometric analysis of intracellular ROS levels, with representative images. n = 3 per group. I) Quantification of MitoSOX evaluated mitochondrial ROS showing levels of mitochondria‐derived ROS in the SCs. n = 6 per group. J) Representative images of Mito tracker Green‐labeled mitochondrial morphology and quantification of the mitochondrial aspect ratio. Scale bar, 5 µm. n = 6, each data point indicates a single mitochondrion. K) Flow cytometric analysis of ΔΨm and quantification of the mitochondria membrane potential. n = 3 per group. All data are expressed as mean ± SEM. Each data point represents an individual mouse. Statistical comparisons were conducted with one‐way ANOVA followed by Tukey's post hoc test. *P < 0.05, **P < 0.01, ***P < 0.001 and ****P < 0.0001.
Figure 6
Figure 6
JD5037 attenuates DPN. A) Grouping and timeline for JD administration and the subsequent evaluations. B) Mechanical nociception as evaluated by von Frey test. n = 6 per group. C) Blood glucose assessment. n = 6 per group. D) Electrophysiological evaluations of the nerve conduction velocity at 4 months post‐DM. n = 4 per group. E) Representative electron micrographs of the sciatic nerves and quantifications of the myelin sheath thickness (g‐ratio) and abnormal myelin sheaths. Abnormal myelin sheaths are indicated in viridis. Scale bar, 10 µm (top), 1 µm (bottom). n = 6 per group. F) Representative images and quantification of PGP 9.5‐labeled intraepidermal nerve fibers. Scale bar, 50 µm. n = 15 slices from 3 mice. G) Representative images and quantification of ATF3+ neurons in the affected DRGs. Scale bar, 50 µm. n = 9 slices from 3 mice. All data are expressed as mean ± SEM. Statistical comparisons were conducted with two‐way ANOVA followed by Bonferroni's post hoc test B,C) and one‐way ANOVA followed by Tukey's post hoc test (D‐G). *P < 0.05, ***P < 0.001, and ****P < 0.0001.

References

    1. a) Feldman E. L., Callaghan B. C., Pop‐Busui R., Zochodne D. W., Wright D. E., Bennett D. L., Bril V., Russell J. W., Viswanathan V., Nat. Rev. Dis. Primers 2019, 5, 41; - PubMed
    2. b) Wood H., Nat. Rev. Neurol. 2023, 19, 711. - PubMed
    1. a) Meyer Zu Reckendorf S., Brand C., Pedro M. T., Hegler J., Schilling C. S., Lerner R., Bindila L., Antoniadis G., Knoll B., Nat. Commun. 2020, 11, 2123; - PMC - PubMed
    2. b) Selvarajah D., Kar D., Khunti K., Davies M. J., Scott A. R., Walker J., Tesfaye S., Lancet Diabetes Endocrinol. 2019, 7, 938. - PubMed
    1. a) Elafros M. A., Andersen H., Bennett D. L., Savelieff M. G., Viswanathan V., Callaghan B. C., Feldman E. L., Lancet Neurol. 2022, 21, 922; - PMC - PubMed
    2. b) Pan S., Chan J. R., J. Cell Biol. 2017, 216, 3903; - PMC - PubMed
    3. c) Zhang N., Ji Q., Chen Y., Wen X., Shan F., Cell Death Dis. 2024, 15, 193. - PMC - PubMed
    1. Matsuda L. A., Lolait S. J., Brownstein M. J., Young A. C., Bonner T. I., Nature 1990, 346, 561. - PubMed
    1. a) Koch M., Varela L., Kim J. G., Kim J. D., Hernandez‐Nuno F., Simonds S. E., Castorena C. M., Vianna C. R., Elmquist J. K., Morozov Y. M., Rakic P., Bechmann I., Cowley M. A., Szigeti‐Buck K., Dietrich M. O., Gao X. B., Diano S., Horvath T. L., Nature 2015, 519, 45; - PMC - PubMed
    2. b) Pagotto U., Marsicano G., Cota D., Lutz B., Pasquali R., Endocr. Rev. 2006, 27, 73; - PubMed
    3. c) Di Marzo V., Goparaju S. K., Wang L., Liu J., Batkai S., Jarai Z., Fezza F., Miura G. I., Palmiter R. D., Sugiura T., Kunos G., Nature 2001, 410, 822; - PubMed
    4. d) Hebert‐Chatelain E., Desprez T., Serrat R., Bellocchio L., Soria‐Gomez E., Busquets‐Garcia A., Pagano Zottola A. C., Delamarre A., Cannich A., Vincent P., Varilh M., Robin L. M., Terral G., Garcia‐Fernandez M. D., Colavita M., Mazier W., Drago F., Puente N., Reguero L., Elezgarai I., Dupuy J. W., Cota D., Lopez‐Rodriguez M. L., Barreda‐Gomez G., Massa F., Grandes P., Benard G., Marsicano G., Nature 2016, 539, 555. - PubMed

Substances

LinkOut - more resources