. 2025 Mar;12(12):e2408845.
doi: 10.1002/advs.202408845. Epub 2025 Jan 31.

Lactylation of HDAC1 Confers Resistance to Ferroptosis in Colorectal Cancer

Affiliations

Lactylation of HDAC1 Confers Resistance to Ferroptosis in Colorectal Cancer

Zhou Yang et al. Adv Sci (Weinh). 2025 Mar.

Abstract

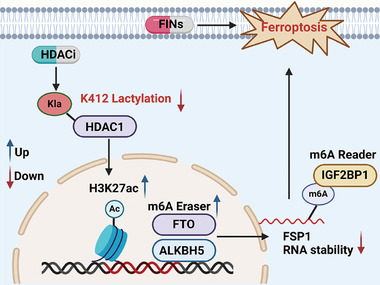
Colorectal cancer (CRC) is highly resistant to ferroptosis, which hinders the application of anti-ferroptosis therapy. Through drug screening, it is found that histone deacetylase inhibitor (HDACi) significantly sensitized CRC to ferroptosis. The combination of HDACi and ferroptosis inducers synergically suppresses CRC growth both in vivo and in vitro. Mechanically, HDACi reduces ferroptosis suppressor protein (FSP1) by promoting its mRNA degradation. Specifically, it is confirmed that HDACi specifically targets HDAC1 and promotes the H3K27ac modification of fat mass- and obesity-associated gene (FTO) and AlkB Homolog 5, RNA Demethylase (ALKBH5), which results in significant activation of FTO and ALKBH5. The activation of FTO and ALKBH5 reduces N6-methyladenosine (m6A) modification on FSP1 mRNA, leading to its degradation. Crucially, lactylation of HDAC1K412 is essential for ferroptosis regulation. Both Vorinostat (SAHA) and Trichostatin A (TSA) notably diminish HDAC1K412 lactylation in comparison to other HDAC1 inhibitors, exhibiting a consistent trend of increasing susceptibility to ferroptosis. In conclusion, the research reveals that HDACi decreases HDAC1K412 lactylation to sensitize CRC to ferroptosis and that the combination of HDACi and ferroptosis inducers can be a promising therapeutic strategy for CRC.

Keywords: HDAC inhibitor; N6‐methyladenosine modification; colorectal cancer; ferroptosis; lactylation.


Conflict of interest statement

The authors declare no conflict of interest.

Figures

Figure 1
Figure 1
HDACi confers the targetable potential of CRC to ferroptosis. A–C) The response of different cancer cell lines to ferroptosis inducers (24 h): RSL3 (A), erastin (B), cystine starvation C). D) Sublethal dose (lethal concentration/LC10‐30) of ferroptosis inducer RSL3 (5 µm) combined with multiple sublethal doses of chemotherapy (doxorubicin: 0.01 µm; irinotecan: 1 µm; oxaliplatin: 5 µm; capecitabine: 5 µm; etoposide: 50 µm), targeted therapy (vemurafenib: 1 µm; SAHA: 1 µm; binimetinib: 5 µm; cetuximab: 100 µg mL−1), and immunotherapy drugs (TNF‐α: 100 ng mL−1). Detailed dose‐response curves of each drug were provided in Figure S1 (Supporting Information). E–F) Gene Ontology (GO) analysis (E) and GSEA (F) of differentially expressed genes between HCT116 cells treated with or without SAHA (1 µm, 24 h). G) Morphological characterization and viability of intestinal organoids treated with SAHA (1 µm) and RLS3 (5 µm) for 24 h. Quantitative detection of intestinal organoid activity (n = 3 organoids per group). H,I) Representative images (H), and tumor volume (I) of HCT116‐derived xenografts. IKE (30 mg kg−1, i.p., per day), SAHA (50 mg kg−1, i.p., per day), 5‐FU (5 mg kg−1, i.p., per 3 days), OXA (5 mg kg−1, i.p., per 3 days), Lip1 (10 mg kg−1, i.p., per day). J) Construction of AOM/DSS induced CRC model and treatment strategy. K,L) Representative images of colons (K), quantifications of tumor number and size (L), and IHC staining of 4‐HNE (ferroptosis index) M), and weight change curve N) in AOM/DSS induced CRC model. IHC was quantified by integrated optical density (IOD). (ns: no significance, * p < 0.05, *** p < 0.001).
Figure 2
Figure 2
HDACi drives response to ferroptosis inducer by repressing FSP1. A) Volcano map showed differentially expressed genes of HCT116 treated with SAHA (1 µm) and TSA (0.1 µm) for 24 h. B) Western Blotting analysis revealed the expression of the main ferroptosis regulator of CRC cells treated with SAHA (1 µm) and TSA (0.1 µm) for 24 h. C) Expression of FSP1 in CRC and paired normal bowel tissues (n = 79). D) Expression of FSP1 in different cell lines detected by Western Blotting. E) Ratio of CoQH2/CoQ of CRC cells treated with SAHA (1 µm) and TSA (0.1 µm) for 24 h. F,G) Lipid peroxidation (F, detected at 12 h) and cell death (G, detected at 24 h) of FSP1‐depleted HCT116 cells treated with SAHA (1 µm) and RSL3 (5 µm). H,I) Lipid peroxidation (H, detected at 12 h) and cell death (I, detected at 24 h) of FSP1‐depleted RKO cells treated with SAHA (1 µm) and RSL3 (5 µm). J–L) Lipid peroxidation of FSP1‐depleted HCT116 cells treated with SAHA (1 µm) and different FINs, including erastin (J, 40 µm), FINO2 (K, 20 µm), and cystine starvation (L) for 12 h. M–O) Cell death of HCT116 cells treated with SAHA and different FINs, including erastin (M, 40 µm), FINO2 (N, 20 µm), and cystine starvation (O) for 24 h. (ns: no significance, * p < 0.05, ** p < 0.01, *** p < 0.001).
Figure 3
Figure 3
HDACi accelerates mRNA degradation of FSP1 dependent on m6A RNA methylation. A,B) mRNA expression (A) and stability (B) of FSP1 in CRC cells treated with SAHA (1 µm) and TSA (0.1 µm) for 24 h. C) Different nucleic acid modifications in CRC cells treated with SAHA (1 µm) and TSA (0.1 µm) for 24 h. N(6)‐methylation of adenosine: m6A; N(1)‐methylation of adenosine: m1A; 5‐methylcytosine: m5C; N7‐methylguanosine: m7G. D) m6A modification of total mRNA in HCT116 cells detected by Dot Blot. E) m6A level of FSP1 mRNA in HCT116 cells detected by meRIP‐qPCR. F,G) The mRNA (F) and protein (G) expression of m6A writers and erasers. H) Overexpression of ALKBH5 and FTO in HCT116 validated by Western Blotting analysis. I–L) Overexpression of ALKBH5 and FTO repressed m6A level (I), mRNA expression (J), mRNA stability (K), and protein expression (L) of FSP1. M,N) Cell death (M, detected at 24 h) and lipid peroxidation (N, detected at 12 h) of HCT116 cells treated with different FINs (RSL3: 5 µM, erastin: 40 µM, FINO2: 20 µM). O) Histon acetylation of FTO and ALKBH5 in HCT116 cells treated with or without SAHA (1 µm, 24 h) detected by CHIP. (ns: no significance, ** p < 0.01, *** p < 0.001).
Figure 4
Figure 4
IGF2BP1 reads m6A modification of FSP1 mRNA. A) Silver stain of immunoprecipitated products of FSP1 sense and antisense probes. B) Potential FSP1 m6A readers revealed by RNA pull‐down MS. C) Enrichment of FSP1 mRNA in IGF2BP1 immunoprecipitated products revealed by RIP‐qPCR. D) Protein expression of IGF2BP1 in CRC cells treated with SAHA and TSA. E–G) Protein expression (E), mRNA expression (F), and mRNA stability (G) of FSP1 in IGF2BP1‐depleted CRC cells. H,I) Cell death (H) and lipid peroxidation of IGF2BP1‐depleted CRC cells treated with different FINs (RSL3: 5 µM, erastin: 40 µM, FINO2: 20 µM). (* p < 0.05, ** p < 0.01, *** p < 0.001).
Figure 5
Figure 5
HDAC1 serves as the main target for HDACi‐regulated ferroptosis. A) Target list of different HDACi. “+/√” represents IC50. ++++: <10 nm +++: 10–50 nm, ++: 50–200 nm, +: >200 nm, √: no IC50 data. (https://www.selleck.cn/). B) Relative cell viability of HCT116 cells treated with different HDACi (LMK‐235: 0.1 µm; romidepsin: 0.05 µm; mocetinostat: 0.5 µm; TSA: 10 µm; TMP269: 0.5 µm; PCI‐34051: 50 µm; pyroxamide: 1 µm; RGFP966: 10 µm; SIS17: 10 µm; tucidinostat: 1 µm; entinostat: 1 µm) and RSL3 for 24 h. C) mRNA expression of HDACs, FSP1, FTO, and ALKBH5 in HCT116 cells transfected with different HDAC siRNAs. D) Expression of FSP1, FTO, and ALKBH5 in HDAC1‐depleted CRC cells. E–I) H3K27ac in the promoters of FTO and ALKBH5 (E), m6A modification in FSP1 mRNA (F), mRNA stability of FSP1 (G), lipid peroxidation (H, detected at 12 h), and cell death (I, detected at 24 h) induced by different FINs (RSL3: 5 µm, erastin: 40 µm, FINO2: 20 µm) in HDAC1‐depleted CRC cells. J) The response curve of wild‐type and HDAC1‐depleted HCT116 cells to multiple doses of RSL3 (0–100 µm, 24 h) with or without combining sublethal concentration of SAHA (1 µm). (** p < 0.01, *** p < 0.001).
Figure 6
Figure 6
Lactylation of HDAC1K412 is essential for ferroptosis regulation. A) Lactylation of HDAC1K412 in CRC tissues. B) Lactate (10 mm, 24 h) enhanced HDAC1K412 lactylation in CRC cells. C) Mutation of HDAC1K412 abolished HDAC1 lactylation. D) IHC staining of HDAC1 and HDAC1K412 lactylation (HDAC1K412la) in CRC and paired normal tissues (n = 79). E) Expression of HDAC1K412la and HDAC1 in CRC cells treated with SAHA and RSL3. F) Expression of HDAC1K412la, HDAC1, FTO, ALKBH5, FSP1, and H3K27ac in HDAC1‐depleted CRC cells transfected with HDAC1 wt and HDACK412R. G–K) H3K27ac in the promoters of FTO and ALKBH5 (G), m6A modification in FSP1 mRNA (H), mRNA stability of FSP1 (I), lipid peroxidation (J) and cell death (K) induced by FINs in HDAC1‐depleted CRC cells transfected with HDAC1 wt and HDACK412R. L) Lipid peroxidation and cell death induced by FINs and SAHA in HDAC1‐depleted HCT116 cells transfected with HDAC1 wt and HDACK412R. (ns: no significance, * p < 0.05, ** p < 0.01, *** p < 0.001).
Figure 7
Figure 7
Schematic working model for HDAC1 lactylation‐driven ferroptosis resistance in CRC.HDAC inhibitors (SAHA and TSA) induce a reduction in lactylation of HDAC1K412, leading to the inhibition of HDAC1 expression and an increase in H3K27 histone acetylation modification. The enhanced histone acetylation modification of H3K27 promotes transcriptional activation of m6A Eraser enzymes (FTO and ALKBH5), resulting in increased expression. Consequently, this leads to a decrease in the m6A modification of FSP1, reduced stability of FSP1, and ultimately decreased levels of FSP1, thereby enhancing sensitivity to ferroptosis.

References

    1. a) Siegel R. L., Miller K. D., Fedewa S. A., Ahnen D. J., Meester R. G., Barzi A., Jemal A., Ca. A. Cancer J. Clin. 2017, 67, 177; - PubMed
    2. b) Zhu J., Tan Z., Hollis‐Hansen K., Zhang Y., Yu C., Li Y., Dig. Dis. Sci. 2017, 62, 235. - PubMed
    1. Yang W. S., SriRamaratnam R., Welsch M. E., Shimada K., Skouta R., Viswanathan V. S., Cheah J. H., Clemons P. A., Shamji A. F., Clish C. B., Brown L. M., Girotti A. W., Cornish V. W., Schreiber S. L., Stockwell B. R., Cell 2014, 156, 317. - PMC - PubMed
    1. a) Zou Y., Palte M. J., Deik A. A., Li H., Eaton J. K., Wang W., Tseng Y. Y., Deasy R., Kost‐Alimova M., Dančík V., Leshchiner E. S., Viswanathan V. S., Signoretti S., Choueiri T. K., Boehm J. S., Wagner B. K., Doench J. G., Clish C. B., Clemons P. A., Schreiber S. L., Nat. Commun. 2019, 10, 1617; - PMC - PubMed
    2. b) Koppula P., Lei G., Zhang Y., Yan Y., Mao C., Kondiparthi L., Shi J., Liu X., Horbath A., Das M., Nat. Commun. 2022, 13, 2206; - PMC - PubMed
    3. c) Magri J., Gasparetto A., Conti L., Calautti E., Cossu C., Ruiu R., Barutello G., Cavallo F., Cells 2021, 10, 108. - PMC - PubMed
    1. Singhal R., Mitta S. R., Das N. K., Kerk S. A., Sajjakulnukit P., Solanki S., Andren A., Kumar R., Olive K. P., Banerjee R., Lyssiotis C. A., Shah Y. M., J. Clin. Invest. 2021, 131, 143691. - PMC - PubMed
    1. Bondarev A. D., Attwood M. M., Jonsson J., Chubarev V. N., Tarasov V. V., Schiöth H. B., Br. J. Clin. Pharmacol. 2021, 87, 4577. - PubMed

MeSH terms

LinkOut - more resources