

Imaging biomarkers of cortical neurodegeneration underlying cognitive impairment in Parkinson's disease
- PMID: 39888421
- PMCID: PMC12014801
- DOI: 10.1007/s00259-025-07070-z
Imaging biomarkers of cortical neurodegeneration underlying cognitive impairment in Parkinson's disease
Abstract
Purpose: Imaging biomarkers bear great promise for improving the diagnosis and prognosis of cognitive impairment in Parkinson's disease (PD). We compared the ability of three commonly used neuroimaging modalities to detect cortical changes in PD patients with mild cognitive impairment (PD-MCI) and dementia (PDD).
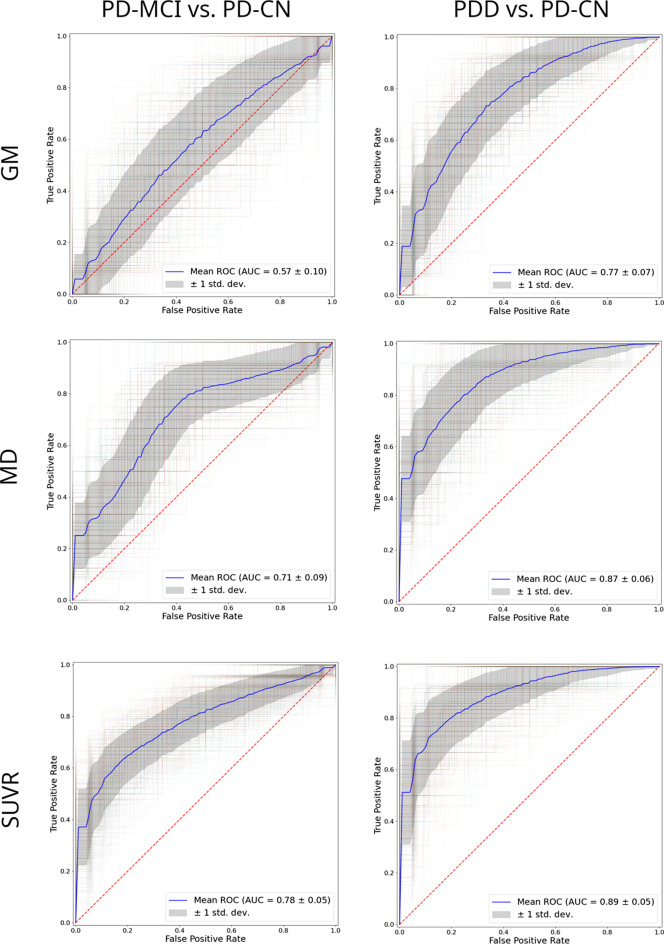
Methods: 53 cognitively normal PD patients (PD-CN), 32 PD-MCI, and 35 PDD underwent concurrent structural MRI (sMRI), diffusion-weighted MRI (dMRI), and [18F]FDG PET. We extracted grey matter volumes (sMRI), mean diffusivity (MD, dMRI), and standardized uptake value ratios ([18F]FDG PET) for 52 cortical regions included in a neuroanatomical atlas. We assessed group differences using ANCOVA models and further applied a cross-validated machine learning approach to identify the modality-specific brain regions that are most indicative of dementia status and assessed their diagnostic accuracy for group separation using receiver operating characteristic analyses.
Results: In sMRI, atrophy of temporal and posterior-parietal areas allowed separating PDD from PD-CN (AUC = 0.77 ± 0.07), but diagnostic accuracy was poor for separating PD-MCI from PD-CN (0.57 ± 0.10). dMRI showed most pronounced diffusivity changes in the medial temporal lobe, which provided excellent diagnostic performance for PDD (AUC = 0.87 ± 0.06), and a more modest but still significant performance for PD-MCI (AUC = 0.71 ± 0.09). Finally, [18F]FDG PET revealed pronounced hypometabolism in posterior-occipital regions, which provided the highest diagnostic accuracies for both PDD (AUC = 0.89 ± 0.05) and PD-MCI (AUC = 0.78 ± 0.05). In statistical comparisons, both [18F]FDG PET (p < 0.001) and dMRI (p < 0.031) outperformed sMRI for detecting PDD and PD-MCI.
Conclusion: Among the tested modalities, [18F]FDG PET was most accurate for detecting cortical changes associated with cognitive impairment in PD, especially at early stages. Diffusion measurements may represent a promising MRI-based alternative.
Keywords: Atrophy; Cognitive decline; DTI; Hypometabolism; MRI; Mean diffusivity; Parkinson’s disease; [18F]FDG PET.
© 2025. The Author(s).
Conflict of interest statement
Declarations. Ethical approval: This study was performed in line with the principles of the Declaration of Helsinki. Approval was granted by the Ethics Committee of the University hospital ‘Virgen del Rocío’ (Date: 08/01/2021, approval number: 2158-N-20). Consent to participate: Informed consent was obtained from all individual participants included in the study. Competing interests: The authors have no relevant financial or non-financial interests to disclose.
Figures


References
-
- Hanagasi HA, Tufekcioglu Z, Emre M. Dementia in Parkinson’s disease. J Neurol Sci. 2017;374:26–31. - PubMed
-
- Hely MA, Reid WGJ, Adena MA, Halliday GM, Morris JGL. The Sydney multicenter study of Parkinson’s disease: the inevitability of dementia at 20 years: twenty Year Sydney Parkinson’s study. Mov Disord. 2008;23:837–44. - PubMed
-
- Aarsland D, Batzu L, Halliday GM, Geurtsen GJ, Ballard C, Ray Chaudhuri K, et al. Parkinson disease-associated cognitive impairment. Nat Rev Dis Primers. 2021;7:47. - PubMed
-
- Lin C-H, Wu R-M. Biomarkers of cognitive decline in Parkinson’s disease. Parkinsonism Relat Disord. 2015;21:431–43. - PubMed
MeSH terms
Substances
LinkOut - more resources
Full Text Sources
Medical
