

Ultraprocessed Food Consumption and Obesity Development in Canadian Children
- PMID: 39888617
- PMCID: PMC11786234
- DOI: 10.1001/jamanetworkopen.2024.57341
Ultraprocessed Food Consumption and Obesity Development in Canadian Children
Abstract
Importance: Ultraprocessed foods (UPF), characterized as shelf-stable but nutritionally imbalanced foods, pose a public health crisis worldwide. In adults, UPF consumption is associated with increased obesity risk, but findings among children are inconsistent.
Objectives: To examine the associations among UPF intake, anthropometric adiposity indicators, and obesity status in Canadian children.
Design, setting, and participants: In the CHILD Cohort Study, one of the largest prospective, multicenter, population-based pregnancy cohorts in Canada, diet was assessed during the 3-year visit (September 2011 to June 2016), and anthropometric measurements were assessed at the 5-year visit (December 2013 to April 2018). Data analysis was performed between July 1, 2023, and June 30, 2024.
Exposure: Diet intake was assessed using a semiquantitative food frequency questionnaire at 3 years of age. UPFs were identified using the NOVA classification system.
Main outcomes and measures: Anthropometric adiposity indicators were measured at 5 years of age and used to calculate age- and sex-standardized z scores for body mass index (BMI), waist to height ratio, and subscapular and triceps skinfold thicknesses, and obesity, which was defined using BMI z score cutoffs. Multivariable-adjusted regression analyses were used to examine the associations of UPF with adiposity and obesity development, accounting for parental, birth, and early-childhood factors.
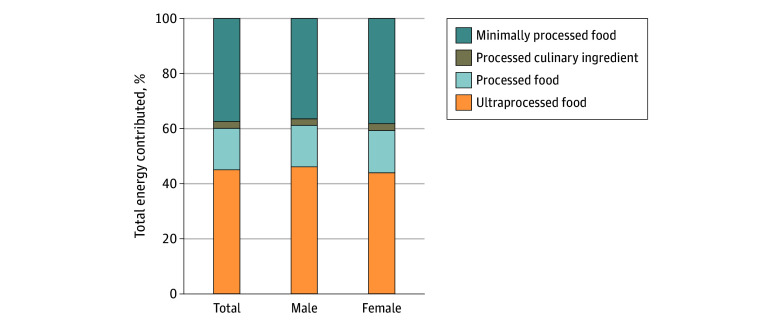
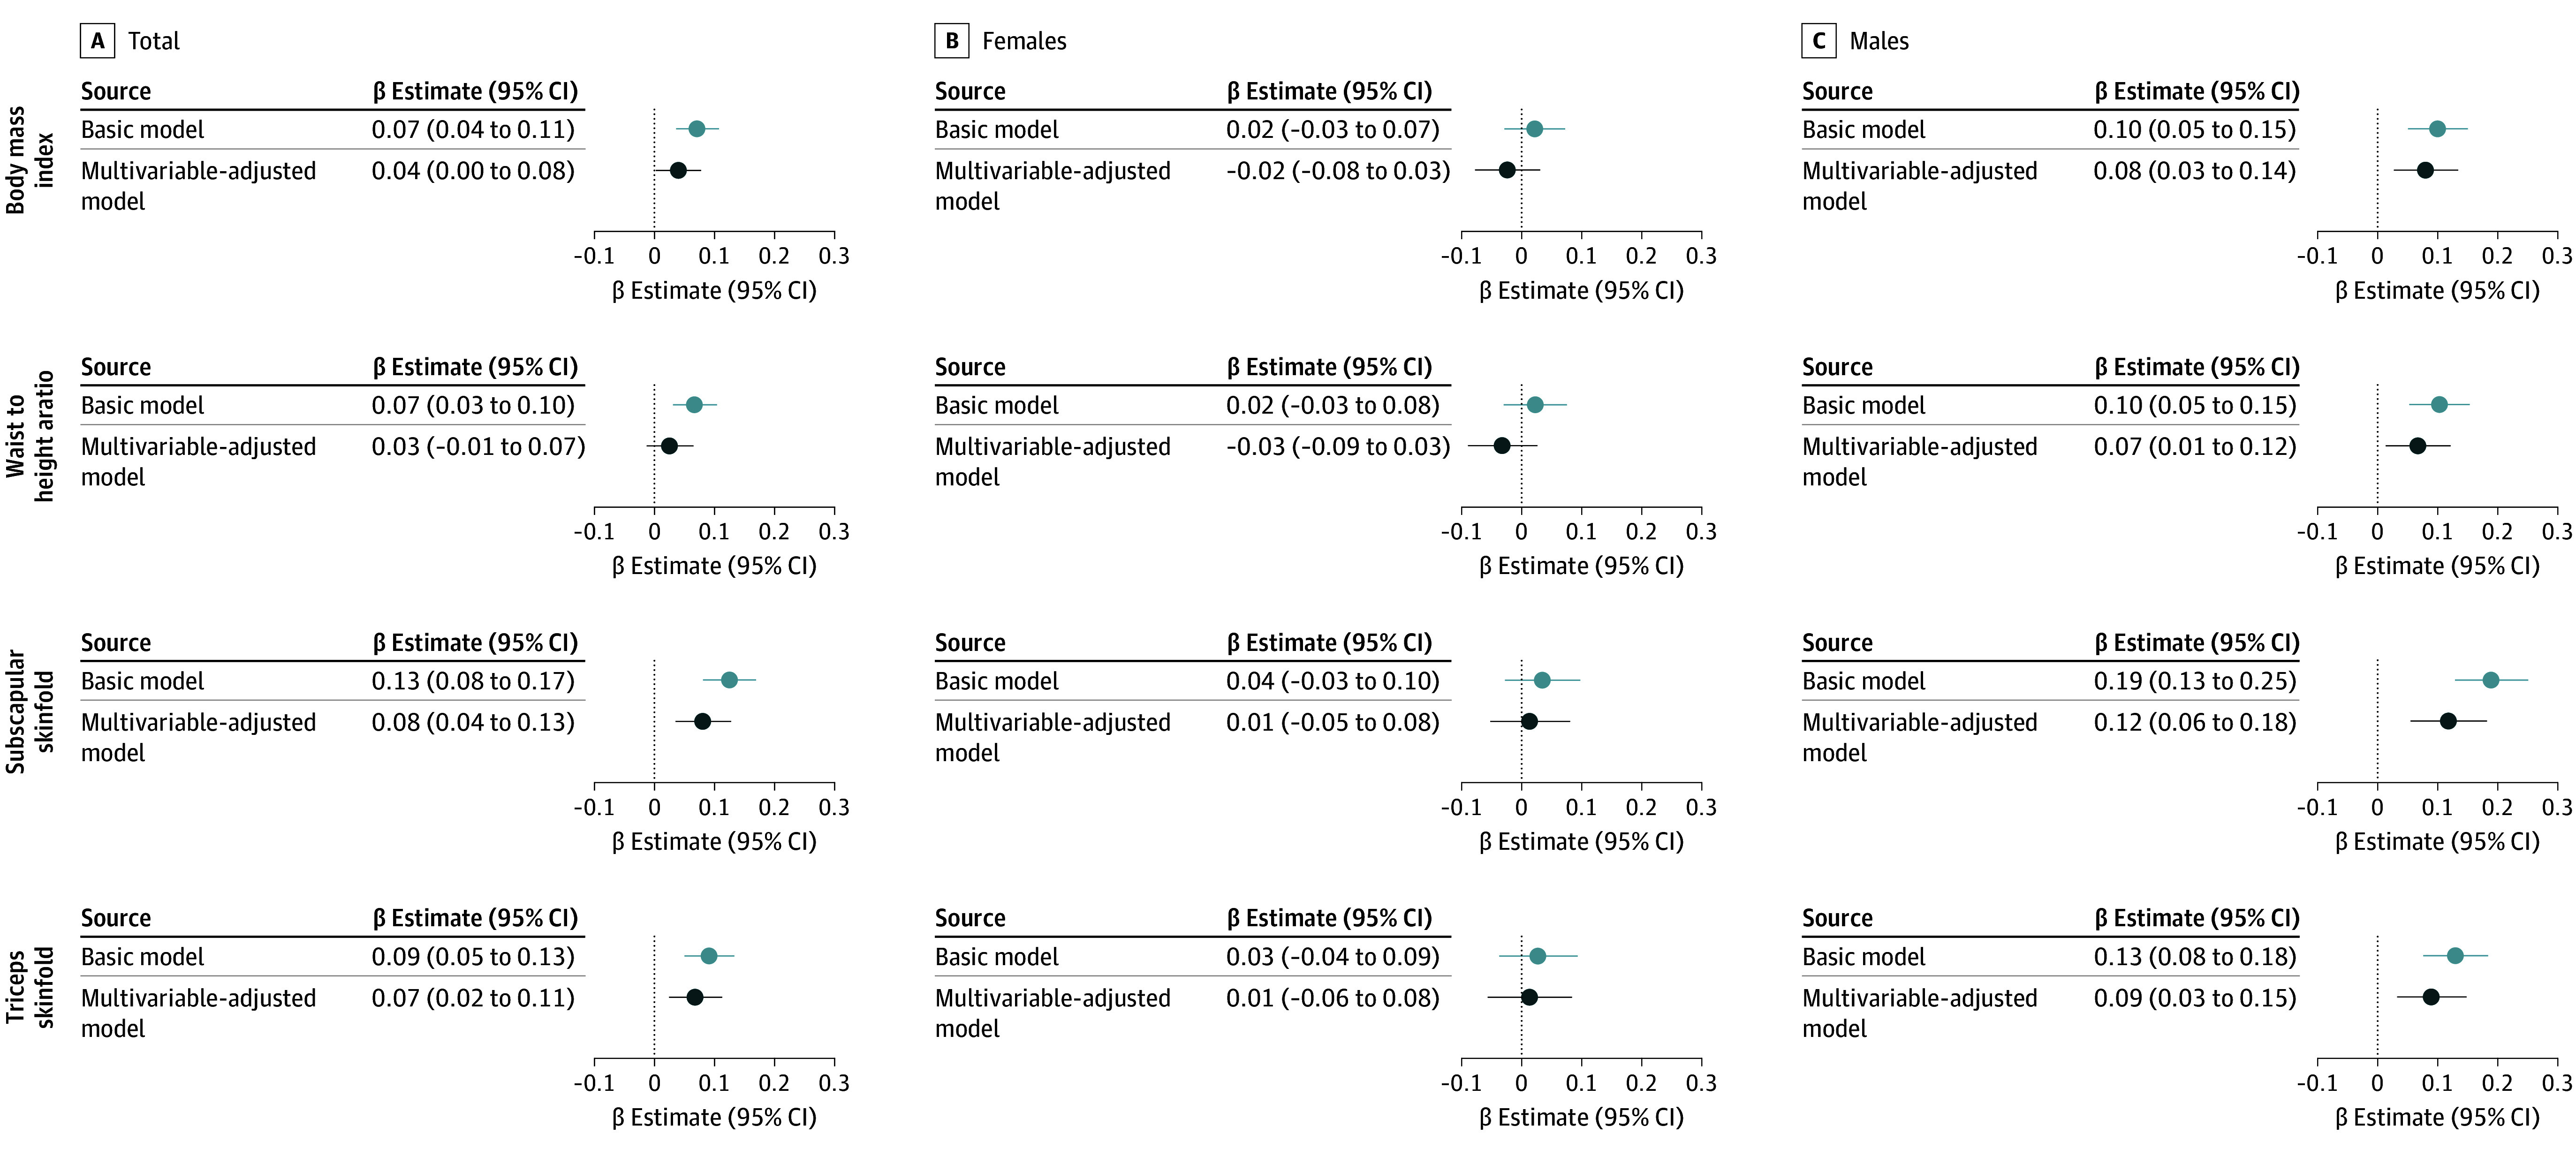
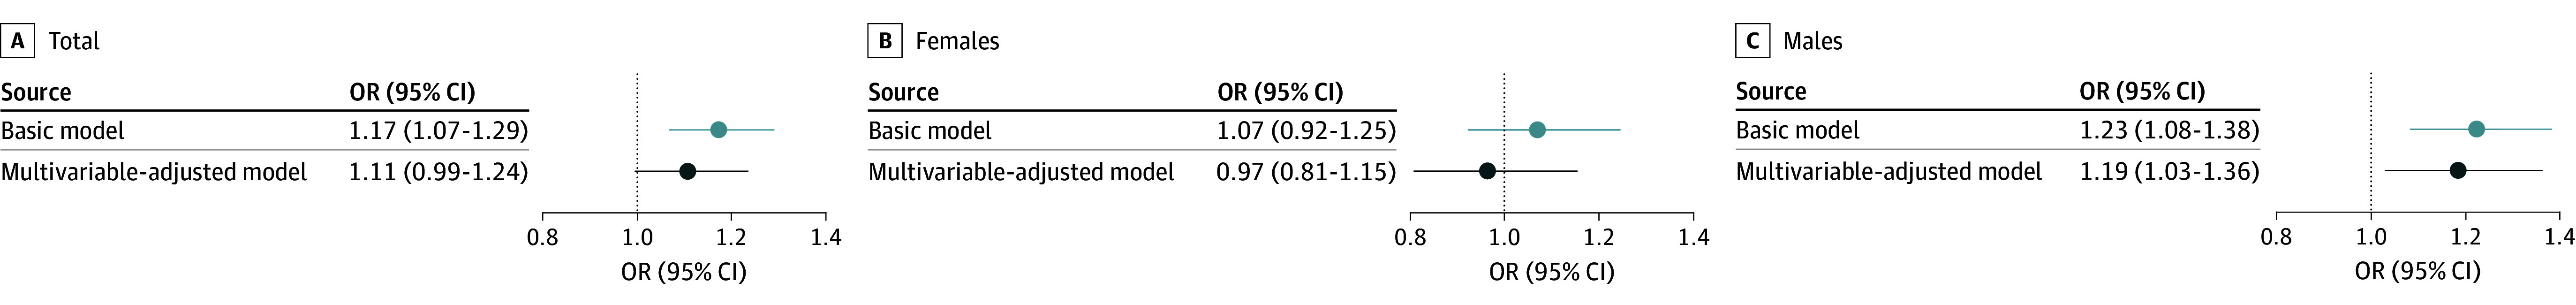
Results: Among 2217 participants included in this study, median age at the outcome assessment was 5.0 (IQR, 5.0-5.1) years, and 1175 (53.0%) were males. At 3 years of age, UPF contributed 45.0% of total daily energy intake. UPF energy contribution was higher in males vs females (46.0% vs 43.9%; P < .001). Among all participants, higher UPF intake at 3 years of age was associated with higher anthropometric adiposity indicators at 5 years of age, primarily driven by males. In males, every 10% UPF energy increase was associated with higher adiposity indicator z scores for BMI (β, 0.08; 95% CI, 0.03-0.14), waist to height ratio (β, 0.07; 95% CI, 0.01-0.12), and subscapular (β, 0.12; 95% CI, 0.06-0.18) and triceps (β, 0.09; 95% CI, 0.03-0.15) skinfold thickness and higher odds of living with overweight or obesity (odds ratio, 1.19; 95% CI, 1.03-1.36). No significant associations were observed among females.
Conclusions and relevance: In this cohort study of Canadian children, high UPF consumption during early childhood was associated with obesity development, primarily in males. These findings can inform targeted public health initiatives for early childhood centers and caregiver education programs to reduce UPF intake and prevent obesity.
Conflict of interest statement
Figures
References
-
- Pan American Health Organization, World Health Organization . Ultra-Processed Food and Drink Products in Latin America: Trends. Impact on Obesity, Policy Implications; 2015.
-
- Monteiro CA, Cannon G, Lawrence M, Louzada ML, Machado P. Ultra-processed foods, diet quality, and health using the NOVA classification system. August 1, 2019. Accessed August 10, 2023. https://openknowledge.fao.org/server/api/core/bitstreams/5277b379-0acb-4...
Publication types
MeSH terms
LinkOut - more resources
Full Text Sources
Medical
Miscellaneous
