

Classification and Regression Trees analysis identifies patients at high risk for kidney function decline following hospitalization
- PMID: 39888928
- PMCID: PMC11785296
- DOI: 10.1371/journal.pone.0317558
Classification and Regression Trees analysis identifies patients at high risk for kidney function decline following hospitalization
Abstract
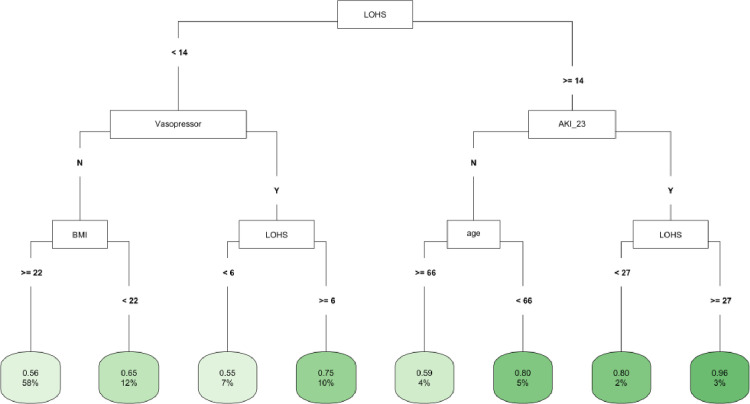
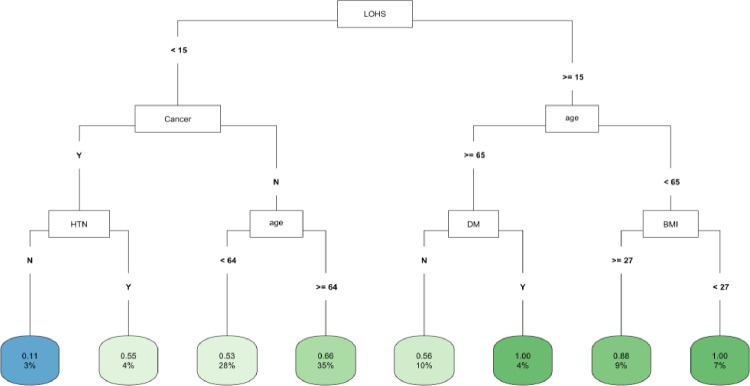
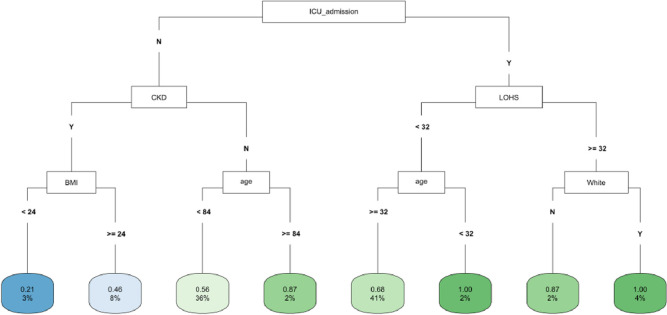
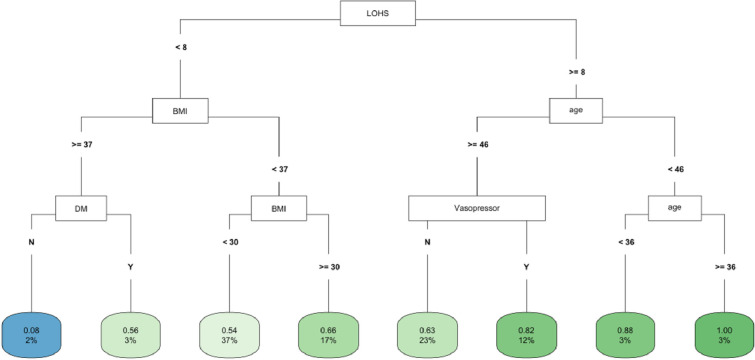
Estimated glomerular filtration rate (eGFR) decline is associated with negative health outcomes, but the use of decision tree algorithms to predict eGFR decline is underreported. Among patients hospitalized during the first year of the COVID-19 pandemic, it remains unclear which individuals are at the greatest risk of eGFR decline after discharge. We conducted a retrospective cohort study on patients hospitalized at Stony Brook University Hospital in 2020 who were followed for 36 months post discharge. Random Forest (RF) identified the top ten features associated with fast eGFR decline. Logistic regression (LR) and Classification and Regression Trees (CART) were then employed to uncover the relative importance of these top features and identify the highest risk patients. In the cohort of 1,747 hospital survivors, 61.6% experienced fast eGFR decline, which was associated with younger age, higher baseline eGFR, and acute kidney injury (AKI). Multivariate LR analysis showed that older age was associated with lower odds of fast eGFR decline whereas length of hospitalization and vasopressor use with greater odds. CART analysis identified length of hospitalization as the most important factor and that patients with AKI and hospitalization of 27 days or more were at highest risk. After grouping by ICU and COVID-19 status and propensity score matching for demographics, these risk factors of fast eGFR decline remained consistent. CART analysis can help identify patient subgroups with the highest risk of post-discharge eGFR decline. Clinicians should consider the length of hospitalization in post-discharge monitoring of kidney function.
Copyright: © 2025 Wang et al. This is an open access article distributed under the terms of the Creative Commons Attribution License, which permits unrestricted use, distribution, and reproduction in any medium, provided the original author and source are credited.
Conflict of interest statement
The authors have declared that no competing interests exist.
Figures

Similar articles
-
COVID-19-Associated Acute Kidney Injury and Longitudinal Kidney Outcomes.JAMA Intern Med. 2024 Apr 1;184(4):414-423. doi: 10.1001/jamainternmed.2023.8225. JAMA Intern Med. 2024. PMID: 38407862 Free PMC article.
-
Assessment of Acute Kidney Injury and Longitudinal Kidney Function After Hospital Discharge Among Patients With and Without COVID-19.JAMA Netw Open. 2021 Mar 1;4(3):e211095. doi: 10.1001/jamanetworkopen.2021.1095. JAMA Netw Open. 2021. PMID: 33688965 Free PMC article.
-
Acute Kidney Injury in a National Cohort of Hospitalized US Veterans with COVID-19.Clin J Am Soc Nephrol. 2020 Dec 31;16(1):14-25. doi: 10.2215/CJN.09610620. Epub 2020 Nov 16. Clin J Am Soc Nephrol. 2020. PMID: 33199414 Free PMC article.
-
Risk of acute kidney injury after contrast-enhanced computerized tomography: a systematic review and meta-analysis of 21 propensity score-matched cohort studies.Eur Radiol. 2022 Dec;32(12):8432-8442. doi: 10.1007/s00330-022-08916-y. Epub 2022 Jun 21. Eur Radiol. 2022. PMID: 35727320 Free PMC article.
-
COVID-19-associated AKI.Curr Opin Crit Care. 2022 Dec 1;28(6):630-637. doi: 10.1097/MCC.0000000000000988. Epub 2022 Oct 3. Curr Opin Crit Care. 2022. PMID: 36194146 Free PMC article. Review.
References
MeSH terms
LinkOut - more resources
Full Text Sources
Medical
Research Materials
Miscellaneous
