. 2025 Jan 31;21(1):e1011533.
doi: 10.1371/journal.pgen.1011533. eCollection 2025 Jan.

Rapid expansion and specialization of the TAS2R bitter taste receptor family in amphibians

Affiliations

Rapid expansion and specialization of the TAS2R bitter taste receptor family in amphibians

Kathleen W Higgins et al. PLoS Genet. .

Abstract

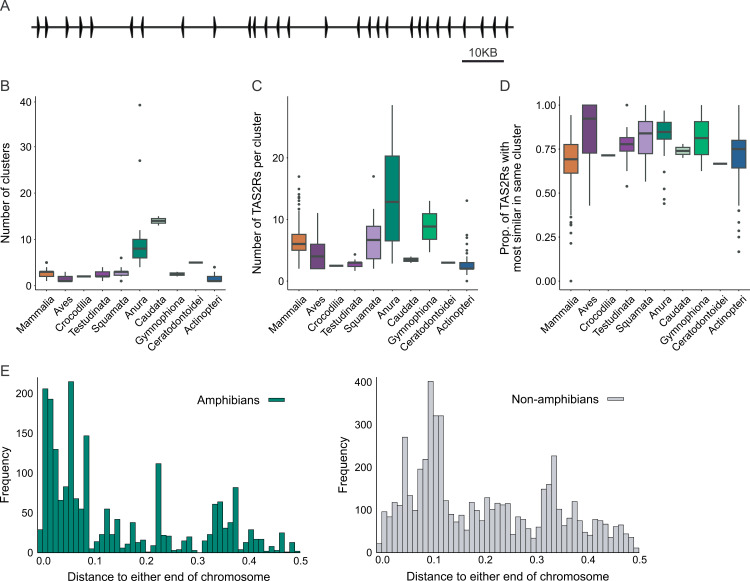
TAS2Rs are a family of G protein-coupled receptors that function as bitter taste receptors in vertebrates. Mammalian TAS2Rs have historically garnered the most attention, leading to our understanding of their roles in taste perception relevant to human physiology and behaviors. However, the evolution and functional implications of TAS2Rs in other vertebrate lineages remain less explored. Here, we identify 9,291 TAS2Rs from 661 vertebrate genomes. Large-scale phylogenomic analyses reveal that frogs and salamanders contain unusually high TAS2R gene content, in stark contrast to other vertebrate lineages. In most species, TAS2R genes are found in clusters; compared to other vertebrates, amphibians have additional clusters and more genes per cluster. We find that vertebrate TAS2Rs have few one-to-one orthologs between closely related species, although total TAS2R count is stable in most lineages. Interestingly, TAS2R count is proportional to the receptors expressed solely in extra-oral tissues. In vitro receptor activity assays uncover that many amphibian TAS2Rs function as tissue-specific chemosensors to detect ecologically important xenobiotics.


Conflict of interest statement

I have read the journal's policy and the authors of this manuscript have the following competing interests: J.-K.W. is a member of the Scientific Advisory Board and a shareholder of DoubleRainbow Biosciences, Galixir and Inari Agriculture, which develop biotechnologies related to natural products, drug discovery, and agriculture. The remaining authors declare no other competing interests.

Figures

Fig 1
Fig 1. Distinct evolutionary patterns of TAS2Rs in amphibian genomes compared to other vertebrates.
(A) Evolution of TAS2R gene content across the 645 vertebrate species examined. Bars adjacent to the phylogeny represent TAS2R counts observed in extant species, and are colored by taxonomic lineage. Tree branches are colored according to DupliPHY ancestral state reconstructions, and were plotted following Revell, 2013 [117]. Note that the color bar is on a logarithmic scale to facilitate visualization. The evolutionary regime shifts from the best-fitting models of continuous traits are labeled as dots on tree branches. The red dots represent the five well-supported shifts considered, and the gray dot represents the sixth shift, which had ambiguous support (see Results section and S3 Fig for details). (B) Boxplots of TAS2Rs content in vertebrate genomes grouped by taxonomic group. (C) CAFE4 birth (λ) and death (μ) rate estimates for the TAS2R family in four vertebrate lineages. (D) Radial phylogenetic tree showing 9,306 TAS2Rs from 681 unique species. The tree also includes 214 published TAS2R sequences which were used to scaffold the alignment, in addition to six zebrafish ORA sequences as outgroups. Branches were colored according to major taxonomic groups, as indicated on the right. Approximate Bayes (aBayes) probabilities are noted as circles on the deep nodes, with red showing confidence greater than 0.95, orange showing confidence 0.90 to 0.95, and yellow showing confidence below 0.90. The tree data with NCBI accessions is shown in S3 Data.
Fig 2
Fig 2. Tandem organization of TAS2R gene families promotes rapid copy number evolution.
(A) Diagram of a western clawed frog gene cluster spanning 160 KB and containing 28 TAS2Rs found on chromosome 9 (aka CM004451.2 or NC_030685.2). (B) Boxplot showing clusters per genome. Only species that have TAS2Rs are included. (C) Boxplot showing TAS2Rs per cluster. Only species that have clusters are included. (D) Boxplot showing proportion of TAS2Rs with the most similar gene in the same cluster. Only species that have clusters are included. (E) Chromosomal location of TAS2Rs for amphibian (left) and non-amphibian (right) genes. Along the x-axis, 0.0 represents either end and 0.5 is the numerical center of the chromosome. Alternative representations colored by genome assembly qualities (i.e., BUSCO gene completeness and contig N50) or sorted by the several parameters of genome assembly qualities are shown in S6 Fig.
Fig 3
Fig 3. Despite rapid turnover of TAS2R genes, TAS2R clusters are deeply conserved.
(A) Comparison between TAS2R repertoires of closely related species, based on the tree in Fig 1B. First panel shows the comparison between the African clawed frog and western clawed frog, which diverged 58 MYA. The outgroup is the Congo frog, which has 45 TAS2Rs. The second panel shows the wood frog and common frog (divergence 33 MYA) with the outgroup of the pixie frog (98 genes). The third shows the human and the white-tufted-ear marmoset (divergence 43 MYA) with the outgroup of the slow loris (22 genes). The final panel shows the vampire and northern bats (divergence 51 MYA) with the outgroup of the fruit bat (15 genes). Additional comparisons are available in S8 Fig. (B) Plot of fraction of all genes that are CNCOs, meaning that they have 2+ copies in fewer than 5% of species represented by this region of the species tree, and exactly one copy in over 50% of species. To control for varying gene family sizes, we display the data in terms of individual genes (with a gene family often containing multiple genes in the same species). Note that “reptiles” excludes birds, and “fish” only includes actinopterygii. (C) Minimum age estimates for a subset of clusters, with orthology of clusters defined by conserved neighboring BUSCO genes. (D) Schematic illustrating a specific conserved cluster found in members of all major tetrapod lineages, making it at least 352 MY old. Conserved BUSCO marker genes shown as colored arrows, with arrowhead conveying directionality. TAS2R cluster shown as gray line with number of included genes above it. (E) Subset of Fig 2 focusing on the saltmarsh sparrow and dark-eyed junco on the left. Coloring reflects locus identity, matching chromosomal diagram on right. In the chromosomal diagram, each TAS2R locus is shown as a bar in the approximate location of this TAS2R singleton or cluster. In the case of immediately adjacent clusters (i.e., AC1/AC2 and JH2/JH3), the distance between them has been exaggerated slightly to resolve the separate loci.
Fig 4
Fig 4. TAS2R amplification in batrachians is accompanied by extra-oral-specific utilization.
(A) Photos and latin names for species included in transcriptomic analysis. Photos of the Rhinella marina and Phyllobates terribilis were obtained from Brian Gratwicke under CC BY 2.0. The photos of Ambystoma mexicanum and Lithobates catesbianus were taken by Jing-Ke Weng (author), and the photo of Xenopus tropicalis was taken by Akihiro Itoigawa (author). (B) Tree of major amphibian families, with amphibians included in this study shown in colors matching boxes in Fig 4A. Topology and divergence times follow Pyron [118]. (C) Percent of receptors in genome that are expressed in any sequenced tissue. (D) Percent of receptors in genome that are expressed in specific tissues. (E) Percent of expressed receptors that are expressed in exactly one tissue. (F) Correlation between number of receptors in genome and number of receptors that are expressed in at least one extra-oral tissue (but not the tongue). (G) Colocalization matrices showing Spearman coefficients for TAS2R overlap between pairs of amphibian tissues in five different amphibian species.
Fig 5
Fig 5. Phylogenetically related genes often have similar patterns of expression.
All trees in this figure were created from S4 Data, which is shown in S15 Fig. Branch lengths represent phylogenetic distance, with scale shown below each subtree. Coloring represents different species. Icons represent tissue expression as shown in legend. (A) Root of tree highlighting relationship between axolotl TAS2R42 and TAS2R43. Triangle represents the collapse of the rest of the tree. (B) Subset of tree showing single chicken receptor clustering with amphibian receptors. (C) Subset of tree showing a rare example of orthology between all five batrachian species. (D) Subset of tree showing bullfrog-specific radiation with intestinal and liver expression. (E) Subset of tree showing clade containing bullfrog, cane, and dart receptors expressed in the tongue and brain (among others).
Fig 6
Fig 6. Extra-oral receptors sensitive to ligands that act in extra-oral tissues.
(A) schematic illustrating our in vitro functional assay inside a human embryonic kidney (HEK293T) cell. Activation of the TAS2R by an extracellular bitterant causes calcium release from the endoplasmic reticulum, which reacts with coelenterazine and clytin-II in the mitochondrial matrix to produce blue light. (B) Raw readout of luminescence during a positive bitter assay, with bullfrog TAS2R61 as an example. The orange curve shows the data for aflatoxin B1 and the gray curve is for the buffer condition. For clarity, only one replicate is shown for each condition. (C) Diagram showing phylogenetic tree, heatmap for expression data, and heatmap for receptor activity. Phylogenetic tree is subset from the large tree in S15 Fig. Receptors not responding to any tested substances in our functional assay were represented in gray. Expression data are measured in fragments per kilobase of transcript per million mapped reads (FPKM) and are shown on a log scale, with 0.1 added to allow for FPKM = 0 values. Functional assay data are white if not significantly higher than buffer (two-sided Welch’s t-tests corrected by Benjamini-Hochberg adjustment with α = 0.05). Significant data are normalized to the largest chemical to buffer difference for each receptor, with 100% of receptor maximum shown in dark green with a linear scale down to a 0% difference in white. Chemicals are split into ecologically relevant substances (left) and classic bitterants (right), and then alphabetized within each group. Fungal toxins, frogs’ toxins, and natural alkaloids are represented in orange, purple, and light blue, respectively. (D) Dose response relationships for eight important receptor/ligand pairs (n = 6–9, mean ± SEM). Lines are represented in orange for aflatoxin B1, green for cinobufagin, and purple for marinobufagenin. Insets show the magnifying displays for a subset of ligands. Asterisks indicate minimum concentrations where T2R-transfected cells showed responses significantly higher than those in the lowest concentration (p < 0.05, Dunnett’s tests).

References

    1. Florsheim EB, Sullivan ZA, Khoury-Hanold W, Medzhitov R. Food allergy as a biological food quality control system. Cell. 2021;184(6):1440–54. doi: 10.1016/j.cell.2020.12.007 - DOI - PubMed
    1. Taruno A, Nomura K, Kusakizako T, Ma Z, Nureki O, Foskett JK. Taste transduction and channel synapses in taste buds. Pflugers Arch. 2021;473(1):3–13. doi: 10.1007/s00424-020-02464-4 - DOI - PMC - PubMed
    1. Hao X, Jiao H, Zou D, Li Q, Yuan X, Liao W, et al.. Evolution of bitter receptor genes and ontogenetic dietary shift in a frog. Proc Natl Acad Sci U S A. 2023;120(8):e2218183120. doi: 10.1073/pnas.2218183120 - DOI - PMC - PubMed
    1. Zhong H, Huang J, Shang S, Yuan B. Evolutionary insights into umami, sweet, and bitter taste receptors in amphibians. Ecol Evol. 2021;11(24):18011–25. doi: 10.1002/ece3.8398 - DOI - PMC - PubMed
    1. Policarpo M, Baldwin MW, Casane D, Salzburger W. Diversity and evolution of the vertebrate chemoreceptor gene repertoire. Nat Commun. 2024;15(1):1421. doi: 10.1038/s41467-024-45500-y - DOI - PMC - PubMed

Substances

LinkOut - more resources