. 2025 Jan 31;10(103):eadn1945.
doi: 10.1126/sciimmunol.adn1945. Epub 2025 Jan 31.

Stem-like memory and precursors of exhausted T cells share a common progenitor defined by ID3 expression

Affiliations

Stem-like memory and precursors of exhausted T cells share a common progenitor defined by ID3 expression

Catarina Gago da Graça et al. Sci Immunol. .

Abstract

Stem-like T cells are attractive immunotherapeutic targets in patients with cancer given their ability to proliferate and differentiate into effector progeny. Thus, identifying T cells with enhanced stemness and understanding their developmental requirements are of broad clinical and therapeutic interest. Here, we demonstrate that during acute infection, the transcriptional regulator inhibitor of DNA binding 3 (ID3) identifies stem-like T cells that are uniquely adapted to generate precursors of exhausted T (Tpex) cells in response to chronic infection or cancer. Expression of ID3 itself enables Tpex cells to sustain T cell responses in chronic infection or cancer, whereas loss of ID3 results in impaired maintenance of CD8 T cell immunity. Furthermore, we demonstrate that interleukin-1 (IL-1) family members, including IL-36β and IL-18, promote the generation of ID3+ T cells that mediate superior tumor control. Overall, we identify ID3 as a common denominator of stem-like T cells in both acute and chronic infections that is specifically required to sustain T cell responses to chronic stimulation.


Conflict of interest statement

Competing interests

R.W.J. receives research support from Roche, BMS, AstraZeneca and MecRx. R.W.J is a scientific consultant and shareholder in MecRx. All other authors declare no competing interests.

Figures
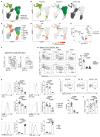
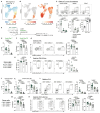
Fig. 1
Fig. 1. ID3 identifies stem-like memory precursors in acute infection.
(A to E) P14 cells were isolated 8 (acute only) or 21 (acute and chronic) days post acute (Armstrong) or chronic (clone-13) LCMV infection for scRNAseq. (A) UMAP plot of 2,916 Armstrong d8-derived (light green), 5,853 Armstrong d21-derived (dark green) and 6,605 clone-13 derived P14 cells (black). Cells were pooled from 1-2 experiments with 5 mice each. (B) UMAP plot highlighting individual P14s from d8 (left) and d21 acute (middle) and chronic infection (right). (C) UMAP colored by annotated T cell subsets. (D) Normalized expression of Tcf7 and Il7r among P14s from d8 acute infection. MP, memory precursor. (E) Volcano plot showing differentially expressed genes (FDR <0.05) between MP1 and MP2. (F to K) 5,000 Id3GFP/+ P14s were transferred into congenically marked naïve mice, infected with acute (Armstrong, F to K) and chronic (Docile, K) LCMV, and analyzed on day 8. (F) TCF1 or CD127 versus KLRG1 expression. (G) ID3 or Ly108 versus CXCR6 expression among CD127+KLRG1- P14s derived from peripheral lymph nodes (LN), spleen or blood, and frequencies of ID3+ MP cells across all three organs. GFP, green fluorescent protein. (H) TCF1, CD127, CD95 and CXCR3 expression among ID3+ and ID3- MP cells as well as KLRG1+ effector T (Teff) cells as depicted in F and G derived from spleen. (I and J) Frequencies (I) and numbers (J) of CD62L+ T cells among ID3+ and ID3- MP cells as well as KLRG1+ Teff cells. (K) PD-1 and TOX expression of ID3+ and CXCR6+ MP cells compared to ID3+ Tpex cells obtained from chronic (Docile) LCMV infected. Symbols (G, I and K) represent individual mice. Data are combined (G, H to J) or representative (H and K) of at least two independent experiments with at least 4 mice. Statistical analyses were performed using one-way ANOVA and Tukey’s multicomparison test (H to K).
Fig. 2
Fig. 2. ID3+ precursor cells give rise to CXCR6+ memory T cells.
(A) Experimental scheme. 10,000 Id3GFP/+ P14 cells were transferred into congenically marked naïve mice prior to infection with acute (Armstrong) or chronic (Docile) LCMV. 8 days post-infection, ID3+CXCR6- and CXCR6+ID3- MP cells as well as KLRG1+ effector T cells and ID3+ Tpex cells were sorted and 5×10⁵ cells transferred into time-matched LCMV Armstrong infected mice. Two weeks post-transfer, donor-derived P14 cells were isolated from the spleen and analyzed. (B) P14 numbers in the spleen. (C) CD127 versus KLRG1 expression among transferred P14 cells on day 22 and frequencies of CD127+ memory T cells (right). (D) CD127 versus CD62L expression among CD127+ T cells and frequencies of CD62L+ memory T cells in all mice (right). (E to G) ID3 versus CXCR6 expression among CD127+ T cells (E) and frequencies of total ID3+ (F) and CXCR6+ID3- (G) memory T cells in all mice. GFP, green fluorescent protein. Symbols (B to D, F and G) represent individual mice. Data are either combined (F and G) or representative (B to D) of two independent experiments with at least 4 mice. Statistical analyses were performed using one-way ANOVA and Tukey’s multicomparison test (B to G).
Fig. 3
Fig. 3. ID3 defines memory T cells preadapted to chronic stimulation.
(A) Enrichment of ‘ID3+ MP2 signature’ (data file S2) across scRNAseq data described in Fig. 1. (B) Normalized gene expression of Id3 and Cxcr6. Dotted area highlights MP2-enriched cells among acute d21-derived cells. (C) 50,000 Id3GFP/+ P14s were transferred into congenically marked naïve mice, infected with acute (Armstrong) LCMV, and analyzed on day 24. ID3 versus CD62L expression among P14s derived from peripheral lymph nodes (LN), spleen or blood, and frequencies of ID3+ (dark green), ID3- (light green) and CD62L- (grey) T cells across all three organs. GFP, green fluorescent protein. (D) Experimental scheme for (E to N). ID3+CD62L+, ID3-CD62L+ and ID3-CD62L-memory P14 cells, as depicted in C, were sorted from day 28 acute (Armstrong) LCMV infected mice, and 6,000 transferred into naïve mice prior to either acute (Armstrong; E to I) or chronic (Docile; J to N) LCMV challenge. (E and J) P14 frequencies among CD8+ T cells in the blood on day 7 post acute (E) or day 7 (J) and 28 (K) post chronic infection. (F and K) P14 numbers in the spleens >4 weeks post-infection with either acute (F) or chronic (K) LCMV challenge. (G) CD62L expression among transferred P14s on day 28 post acute rechallenge. (H and I) P14s from acutely infected mice were ex vivo restimulated with gp33 peptide. (H) Frequencies of TNF+IFN-γ+ double producers (H). (I) Expression and frequencies of IL-2 producers among TNF+IFN-γ+ double producers. (L) ID3 versus TCF1 expression among transferred P14s on day 28 post chronic LCMV challenge. GFP, green fluorescent protein. (M) Numbers of ID3-TCF1- Tex cells. (N) CX3CR1 versus granzyme B (GzmB) expression among Tex of transferred P14s on day 28. Symbols (C and E to N) represent individual mice. Data are combined of 2-3 independent experiments with at least 4 mice. Statistical analyses were performed using one-way ANOVA and Tukey’s multicomparison test (C and E to N).
Fig. 4
Fig. 4. ID3 is required to sustain the CD8+ T cell response to chronic infection.
(A) Experimental scheme. 2,500 Id3GFP/+ (control, ctrl) and 2,500 Id3GFP/GFP (ID3KO) P14 cells were co-transferred into congenically marked naïve mice prior to infection with acute (Armstrong) or chronic (Docile) LCMV. (B) Absolute numbers of control (green or black) and ID3KO (orange) P14s obtained from the spleen of mice infected with acute or chronic LCMV. (C) Fold change in control-to-ID3KO P14 ratio in chronic (black) versus acute (green) LCMV. (D) TCF1 versus TIM-3 expression among control (black) and ID3KO (orange) P14s on day 5 post-infection with chronic LCMV. Graphs show representative flow plots (left) and frequency of TCF1+ P14s for all mice (right). (E) Control (CD45.1/2) versus ID3KO (CD45.2) P14 ratio of TCF1+ Tpex cells and TIM-3+TCF1- Tex cells and absolute numbers of ctrl and ID3KO Tpex and Tex cells on day 5 in all mice (right). (F) Tpex and Tex numbers of ctrl and ID3KO P14s on day 21. (G and H) PD-1 (G) and TOX (H) expression of control (black) and ID3KO (orange) Tpex (solid line) and Tex (dashed line) cells on day 35 post-infection with chronic LCMV. Graphs show representative histograms (left, host CD8+ T cells in grey) as well as calculated mean fluorescent index (MFI, right). (I) Frequencies of IFN-γ+ (left) and TNF+ among IFN-γ+ (right) TCF1+ Tpex and TIM-3+ Tex cells after ex vivo gp33-peptide re-stimulation. Symbols in (B and C) represent the means of 10 mice and in (D to I) individual mice; the lines connect P14 cells within the same host. Data are combined of 2-3 (B to F) or representative of at least two independent experiments with 3 mice (G to I). Statistical analyses were performed using either two-way ANOVA and Sidak’s multicomparison test (B and C) or paired two-tailed Student’s t-test (D to I).
Fig. 5
Fig. 5. ID3 is required for the formation of functional Tpex cells.
(A to C) ID3+ (Tpex) and TIM-3+ (Tex) control and ID3KO P14 cells were purified for RNAseq analysis on day 5 post chronic LCMV (Docile) infection. (A) Venn diagram showing differentially expressed genes between control and ID3KO Tpex or Tex cells. Genes upregulated in control groups are indicated in red, genes upregulated in ID3KO groups are indicated in blue. (B) Volcano plot showing differentially expressed genes (FDR <0.05) between control and ID3KO Tpex cells. (C) Differentially expressed hallmark gene sets between control and ID3KO Tpex cells. (D to F) 5,000 Id3GFP/+ (ctrl) and 5,000 Id3GFP/GFP (ID3KO) P14s were co-transferred into congenically marked naïve mice prior to chronic LCMV (Docile) infection. (D) CD62L versus cKIT expression among ctrl and ID3KO Ly108+ Tpex cells. (E) Frequencies of cKIT+ cells among ctrl and ID3KO Tpex cells. (F) Absolute numbers of CD62L+ ctrl and ID3KO Tpex cells. (G) Experimental scheme for H to N. ID3KO or control Tpex cells were sorted on day 5 post chronic LCMV and 105 Tpex cells transferred into infection-matched mice and analyzed 7 days post-transfer. (H) Frequencies of ctrl and ID3KO cells among total P14 splenocytes. (I) TCF1 versus Ly108 expression among donor-derived P14s and frequencies of TCF1-Ly108- Tex cells. (J) Donor-derived ctrl and ID3KO Tpex and Tex numbers as depicted in I. (K) CXCR3 expression among Tpex cells. (L) Ki67 expression among co-transferred ctrl and ID3KO Tpex cells. (M) CD62L versus cKIT expression among Tpex cells. (N) CX3CR1 versus Ki67 expression among Tex cells. RNAseq was performed with two experimental replicates (each n=10). Symbols (D and E) represent the means of 10 mice and in (F and H to N) individual mice, the lines connect P14s within the same host. Data are representative of (K) or combined (D to J and L to N) of two independent experiments with at least 3 mice. Statistical analyses were performed using paired, two-tailed Student’s t-test (D to N).
Fig. 6
Fig. 6. cKit+ Tpex cells exihibit low stem-like potential.
(A to E) 10,000 Id3GFP/+ P14 cells were transferred into congenically marked naïve mice prior to infection with chronic LCMV (Docile). 5 days post-infection, CD62L+ (purple), CD62L-cKit- (pink) and cKIT+ Tpex cells (blue) were purified for RNA-seq analysis. (A) Scheme showing differentially expressed genes between all three subsets. (B) Principal component analysis (PCA) of all RNA samples. (C) Differentially expressed hallmark gene sets enriched in cKIT+ Tpex cells compared to CD62L+ (left) or CD62L- cKit- Tpex cells (right). (D) Experimental scheme for E to I. 5,000 Id3GFP/+ P14 cells were transferred into congenically marked naïve mice prior to infection with chronic LCMV (Docile). 12 days post-infection, CD62L+ (purple), CD62L-cKIT- (pink) and cKIT+ Tpex cells (blue) were sorted, and equal numbers (2.5-5×10⁶ cells) transferred into time-matched LCMV Docile infected mice. Two weeks post-transfer, donor-derived P14 cells were isolated from the spleen and analyzed. (E) P14 numbers in the spleen. (F) TCF1 versus CX3CR1 expression among transferred P14 cells. (G) Frequencies of CX3CR1+ Tex cells among P14 cells in all mice. (H) Numbers of TCF1+ Tpex (left) and CX3CR1+ Tex cells (right). (I) CD62L versus cKIT expression among donor-derived Tpex cells. (J) Frequencies of CD62L+, CD62L-cKit- and cKIT+ Tpex cells among donor-derived Tpex cells. RNA-seq analysis was performed with two experimental replicates. Symbols (E, G, H and J) represent individual mice. Data are combined of two (E to J) independent experiments with at least 3 mice. Statistical analyses were performed using one-way ANOVA and Tukey’s multicomparison test (E, G, H and J).
Fig. 7
Fig. 7. IL-1 family members such as IL-36β promote the formation of ID3+ T cells.
(A) Experimental scheme for (B to D). Id3GFP/+ (control, ctrl) or Id3GFP/GFP (ID3KO) P14 cells were in vitro activated with gp33-peptide in the presence of different cytokines as indicated and analyzed 5 days post-activation. (B) ID3 versus Ly108 expression on activated P14 cells. GFP, green fluorescent protein. (C) Numbers of ID3lo (white) and ID3hi (blue) P14 cells 5 days post-activation. (D) Numbers of ctrl and ID3KO P14 cells expanded with gp33-peptide in the presence of IL-2 (left), IL-36β (middle) or IL-18 (right) following in vitro activation. (E) Nur77Tempo-P14 cells were in vitro activated with gp33-peptide in the presence of IL-2 (light red), IL-36β (blue) or without cytokine (grey; no cytokine, NC). Shown is representative histogram of Nur77 expression (left) and quantified MFI (right). (F) Experimental scheme for G to I. Congenically marked P14 cells in vitro primed with IL-2 or IL-36β (as in A) and 5×10⁵ P14 cells were transferred into day 6 chronically LCMV (Docile) infected mice and analyzed 9 days post-transfer. (G) Frequency (left) and absolute numbers (right) of total P14 cells primed with IL-2 (light red) or IL-36β (blue) on day 15 post-infection. (H) Frequency of IL-2- or IL-36β-primed TCF1+ Tpex cells on day 15 post-infection. (I) Frequency and numbers (right) of granzyme B (GzmB)+ Tex cells among IL-2- or IL-36β-primed cells. Data are representative of three experiments (B to E) or combined (G to I) of two independent experiments with 4-5 mice. Statistical analyses were performed using unpaired, two-way ANOVA and Sidak’s multicomparison test (D), two-tailed Student’s t-test (G to I) or one-way ANOVA and Tukey’s multicomparison test (E).
Fig. 8
Fig. 8. IL-36β- and IL-18-induced ID3+ T cells mediate superior tumor control.
(A) Experimental scheme for B and C. 8×10⁴ Id3GFP/+ (ctrl) or Id3GFP/GFP (ID3KO) P14 cells were transferred into naïve mice before B16F10-gp33 inoculation with cells. (B) B16F10-gp33 growth in mice. Shown are the mean growth and all individual mice. (C) Survival of tumor-bearing mice after engraftment with ctrl or ID3KO P14s. (D) Experimental scheme for E to L. OT-I T cells were in vitro activated with SIINFEKL peptide in the presence of either IL-2, IL-18 or IL-36β before injecting 5×10⁶ cells into B16F10-Ova bearing mice. (E and F) B16F10-Ova growth in mice (E) and overall survival (F) compared to mice that did not receive OT-Is. (G to I) Frequencies and numbers of IL-2 (light red), IL-18 (dark blue) and IL-36β (blue) in vitro primed OT-Is in tumors 13 days post-transfer (G) or lymph nodes (LN) 6 (H) and 13 (I) days post OT-I transfer. (J) TCF1 versus granzyme B (Gzmb) expression of IL-2, IL-18 and IL-36β primed OT-I cells in the tumor on day 13. Graphs show representative flow plots gated on CD44+PD-1+ OT-I cells (left) and frequencies of TCF1+ Tpex cells (right) in the tumor. (K) Frequencies and numbers of GzmB+ T cells in the tumor. (L) TCF1 versus Ki67 expression of OT-Is in the tumor on day 13 post OT-I transfer. Symbols represent individual mice (G to L); lines represent either individual (B and E) or the means of 6-13 mice per group or individual mice (C and F). Data are representative of two (B and C) or three experiments (E and F), or combined (G to L) of at least two independent experiments with 2-5 mice. Statistical analyses were performed using two-way ANOVA and Dunnett’s multicomparison test (B), one-way ANOVA and Tukey’s multicomparison test (G to L) or log rank (Mantel-Cox) test (C and F).

References

    1. Lugli E, Galletti G, Boi SK, Youngblood BA. Stem, Effector, and Hybrid States of Memory CD8(+) T Cells. Trends in immunology. 2020;41:17–28. doi: 10.1016/j.it.2019.11.004. - DOI - PMC - PubMed
    1. Jameson SC, Masopust D. Understanding Subset Diversity in T Cell Memory. Immunity. 2018;48:214–226. doi: 10.1016/j.immuni.2018.02.010. - DOI - PMC - PubMed
    1. Chang JT, Wherry EJ, Goldrath AW. Molecular regulation of effector and memory T cell differentiation. Nature immunology. 2014;15:1104–1115. doi: 10.1038/ni.3031. - DOI - PMC - PubMed
    1. Gattinoni L, Speiser DE, Lichterfeld M, Bonini C. T memory stem cells in health and disease. Nat Med. 2017;23:18–27. doi: 10.1038/nm.4241. - DOI - PMC - PubMed
    1. Soerens AG, Kunzli M, Quarnstrom CF, Scott MC, Swanson L, Locquiao JJ, Ghoneim HE, Zehn D, Youngblood B, Vezys V, Masopust D. Functional T cells are capable of supernumerary cell division and longevity. Nature. 2023 doi: 10.1038/s41586-022-05626-9. - DOI - PMC - PubMed

Publication types

MeSH terms

Substances