. 2025 Jan 31;11(5):eadr4038.
doi: 10.1126/sciadv.adr4038. Epub 2025 Jan 31.

Touch-evoked traveling waves establish a translaminar spacetime code

Affiliations

Touch-evoked traveling waves establish a translaminar spacetime code

Daniel L Gonzales et al. Sci Adv. .

Abstract

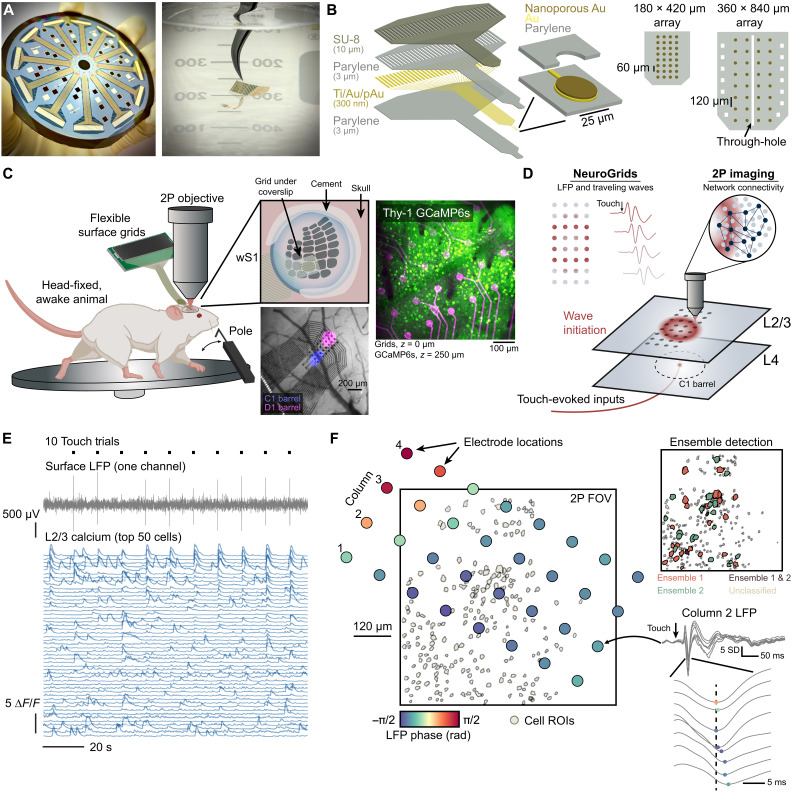
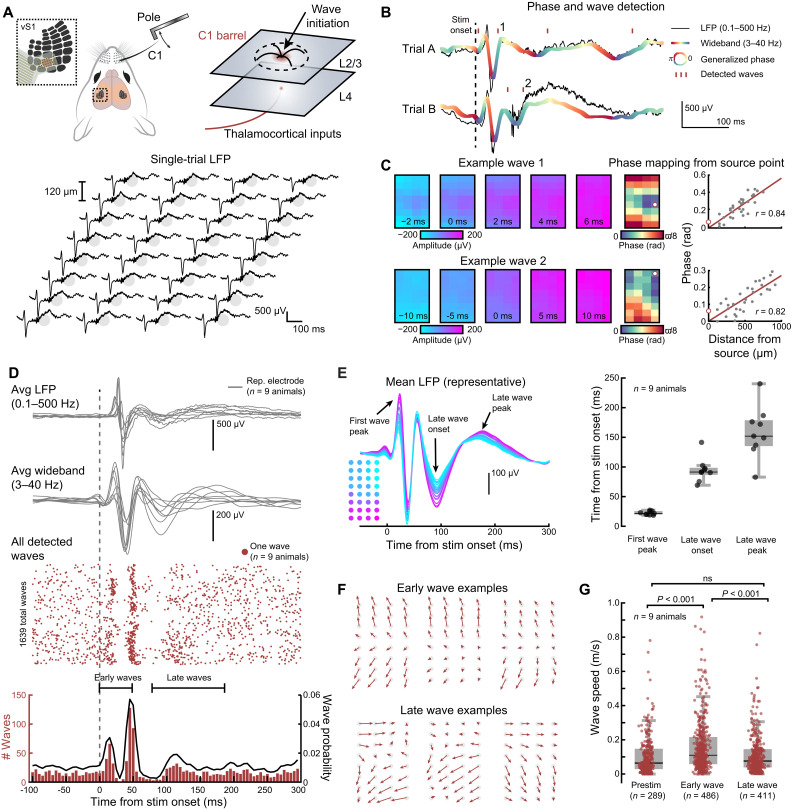
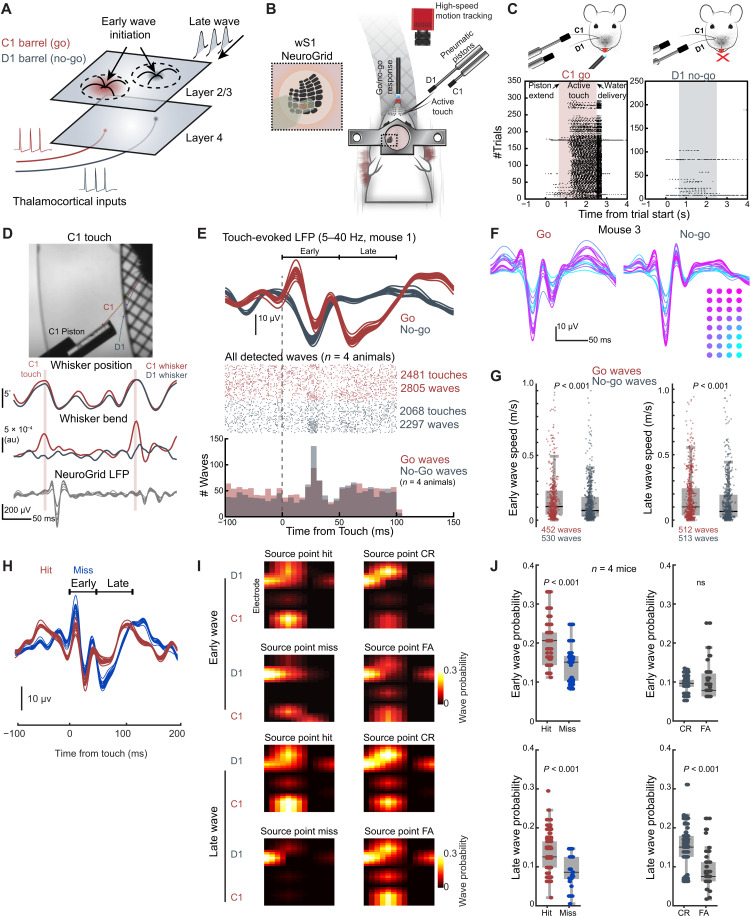
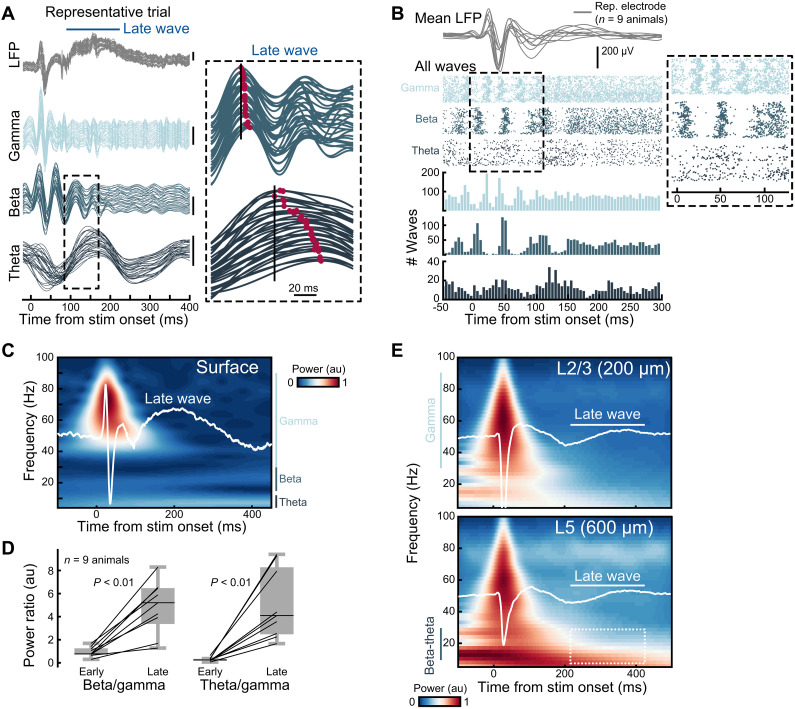
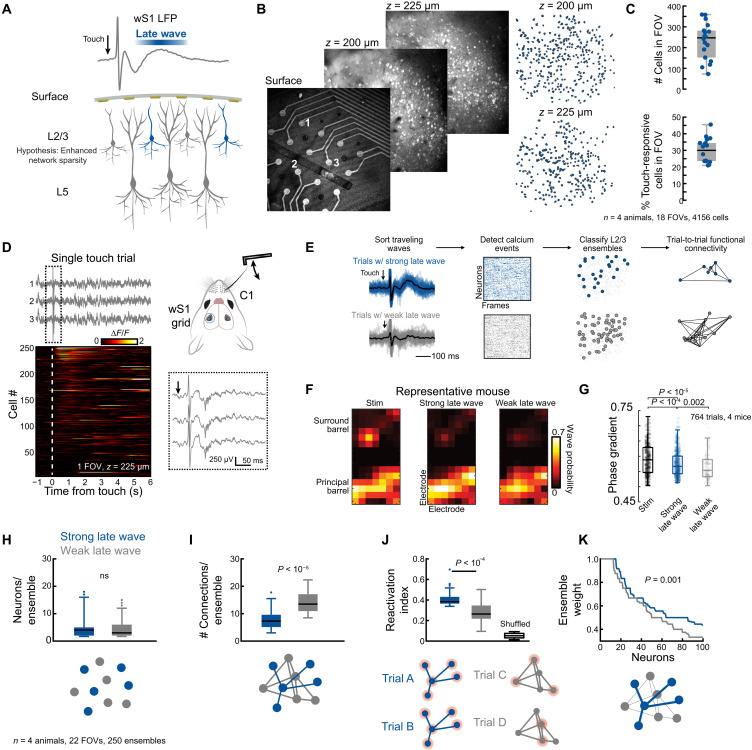
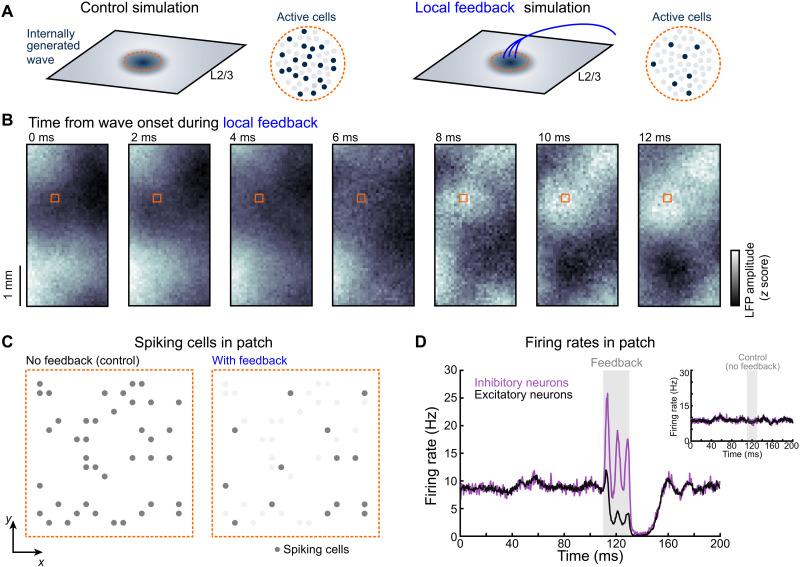
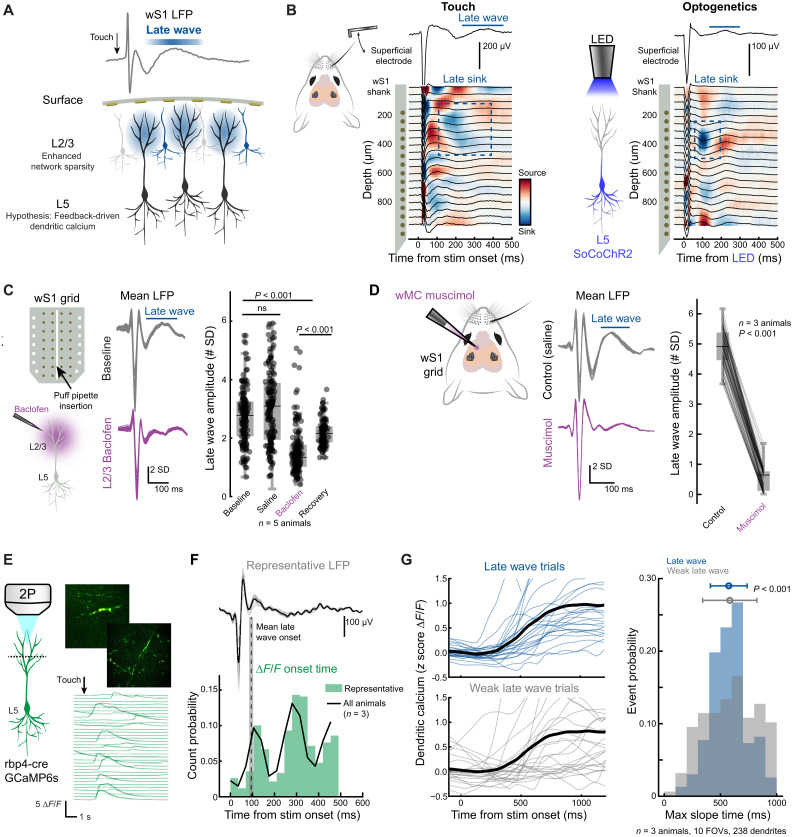
Linking sensory-evoked traveling waves to underlying circuit patterns is critical to understanding the neural basis of sensory perception. To form this link, we performed simultaneous electrophysiology and two-photon calcium imaging through transparent NeuroGrids and mapped touch-evoked traveling waves and underlying microcircuit dynamics. In awake mice, both passive and active whisker touch elicited traveling waves within and across barrels, with a fast early component followed by a late wave that lasted hundreds of milliseconds poststimulus. Notably, late waves were modulated by perceived value and predicted behavioral choice in a two-whisker discrimination task. We found that the late wave feature was (i) modulated by motor feedback, (ii) differentially engaged a sparse ensemble reactivation pattern across layer 2/3, which a balanced-state network model reconciled via feedback-induced inhibitory stabilization, and (iii) aligned to regenerative layer 5 apical dendritic Ca2+ events. Our results reveal that translaminar spacetime patterns organized by cortical feedback support sparse touch-evoked traveling waves.


Figures

Fig. 1.
Fig. 1.. Flexible, transparent grids for simultaneous traveling wave detection and two-photon imaging.
(A) Left: 4″ Silicon wafer with 12 surface grids fabricated simultaneously. Right: Grid held in water to demonstrate flexibility. (B) Left: Cross-sectional stack of the fabricated surface grids. Right: To-scale schematics of the surface grid designs used in this work. (C) Schematic depicting simultaneous surface electrophysiology and two-photon imaging. Awake, head-fixed mice run on a wheel and receive either passive or active whisker touch. Surface grids are acutely implanted over wS1. Top inset shows that we place surface grids onto the brain and seal the cranial window with a glass coverslip. The bottom inset is an image of grids on the brain overlaid with the results of intrinsic-optical imaging used to locate the C1 and D1 barrels. Right inset: Validation of the transparent nature of two-photon imaging through the grids. (D) Schematic representing different recording schemes. Whisker touch evokes traveling waves in the upper cortical layers that are mapped with NeuroGrids. Concurrently, we also capture cellular-scale network activity with two-photon imaging. (E) Example data showing 10 consecutive passive whisker touch trials, LFP recordings from one channel on the grid array, and calcium traces from 50 select cells in the FOV. (F) Left: To-scale schematic showing the exact NeuroGrid locations overlaid with the two-photon FOV and detected ROIs 200 μm below the cortical surface. Electrode colormap depicts the average phase of the LFP in a short 10-ms window following touch. Right, top: Same FOV but the cell ROIs are color-coded to match identified ensembles detected with functional connectivity analysis (see Materials and Methods). Ensemble ROIs are increased in size by 200% for clarity. Right, bottom: Representative example showing the average LFP across column two of the electrode array depicting a progressive traveling wave.
Fig. 2.
Fig. 2.. Whisker touch evokes early and late traveling waves across the barrel cortex.
(A) Top: Schematic of the experimental setup. Bottom: Evoked LFP across the NeuroGrid from a single touch stimulation. (B) Detected traveling waves (two touch trials) using GP. LFP is from a representative channel on the NeuroGrid. The gray line indicates the full LFP spectrum (0.1 to 500 Hz). The thick color line is the wideband LFP signal, filtered from 3 to 40 Hz for traveling wave detection and analysis. Colormap is the calculated GP of the wideband signal. Red dashes indicate LFP oscillations that meet the criteria for classification as a traveling wave [see Materials and Methods and fig. S2 (A to C)]. (C) Left: Example waves 1 and 2 indicated in (B) traveling across the NeuroGrid. Right: Computed phase map and wave source point (white dot; see Materials and Methods). These act as a snapshot of wave propagation. For traveling waves, the phase across the grid strongly correlates with distance from the source point. (D) Average LFP, wideband LFP, and detected traveling waves around the stimulus period for all animals following whisker touch. Only the LFP from one representative channel is shown for each animal. LFP is aligned to the onset of pole motion (n = 9 animals, 1639 total detected waves across 607 trials). (E) Left: Mean grid LFP (3 to 40 Hz) across all trials for a representative animal with distinct features noted. Color mapping indicates grid location. Right: Quantified times for each feature in the average LFP signal using a representative electrode (n = 9 animals). (F) Vector plots showing wave propagation in a representative animal. (G) Wave speed during the prestimulus, early-evoked, and late-evoked periods (n = 9 animals, 289 prestimulus waves, 486 early waves, 411 late waves; P < 0.001 Kruskal-Wallis with a post hoc Dunn-Sidak test). ns, not significant.
Fig. 3.
Fig. 3.. Rewarding action in a go–no-go paradigm modulates early and late traveling wave dynamics during active touch.
(A) Schematic depicting traveling wave initiation and late wave reverberation in two adjacent barrels. (B) Left: Schematic of our two-whisker active touch paradigm. (C) Lick raster plot for a representative animal during go and no-go trials. The shaded area indicates when each piston is extended into the whisking field. Black dots are single licks. (D) Top micrograph shows a DeepLabCut (DLC) pose estimate of the whiskers during C1 touch. Plots show whisker position (top trace), whisker bending (middle trace), and the touch-evoked LFP (bottom trace). (E) Traveling wave detection during C1 and D1 touch. Top: Mean touch-evoked LFP (5 to 40 Hz) for all grid electrodes for a representative animal. Red are go trials, and gray are no-go trials. Middle: Raster plot detected traveling waves across animals during go and no-go trials. Bottom: Histogram of detected waves across animals during go and no-go trials (n = 4 animals, 2481 go touches, 2805 go waves, 2068 no-go touches, and 2297 no-go waves). (F) Mean touch-evoked LFP for all grid electrodes for a representative animal. LFP is color-coded to the electrode location. (G) Early and late wave speed between go and no-go trials (n = 4 animals, 452/512 early/late go waves, 530/513 early/late no-go waves, P < 0.001, rank sum Wilcoxon test). (H) Surface LFP response during hit-and-miss response across the grid for the go whisker (C1). (I) Probability of wave source points for a representative grid covering both barrels [Go- Hits; No Go- Correct Reject (CR); FA, False alarms]. See approximate grid orientation in (B). (J) Top: Early traveling wave probability for each task outcome (n = 4 animals, 2481 go touches and 2068 no-go touches). Bottom: Late traveling wave probability for each task outcome [n = 4 animals, 452 go (hit) waves, 530 no-go (CR) waves, rank sum Wilcoxon test]. au, arbitrary units.
Fig. 4.
Fig. 4.. The beta and theta bands contribute to the late wave.
(A) Single-trial LFP and the corresponding gamma (30 to 90 Hz), beta (15 to 30 Hz), and theta (4 to 12 Hz) frequency bands. The inset shows the beta and theta bands during the onset of the late wave. Red denotes the local maxima and shows wave latencies across the grid. (B) Detected traveling waves in the gamma, beta, and theta bands for all animals (n = 9 animals). Top traces show each animal’s mean touch-evoked LFP on the NeuroGrid on a representative electrode. The raster plot shows the onset times for all detected waves. Inset shows a zoom of the first 100 ms. The histogram shows the combined wave times across animals (n = 9 animals, 14,598 gamma waves, 7100 beta waves, and 2529 theta waves). (C) Mean touch-evoked LFP on the NeuroGrid for a representative animal overlaid on the signal spectrogram. (D) Beta/gamma and theta/gamma power ratios across animals in the early (0 to 50 ms) and late (100 to 250 ms) windows following whisker touch (n = 9 animals, P < 0.01 signed-rank Wilcoxon test). (E) L2/3 and L5 touch-evoked spectrogram for a representative animal from silicon probe recordings (n = 3; see fig. S8). The late wave appears ~200 ms after touch and most clearly correlates with delayed beta-theta coupling in L5.
Fig. 5.
Fig. 5.. Enhanced L2/3 sparsity supports late wave dynamics.
(A) Schematic of a sparse network theory in L2/3 that supports the late wave. (B) Representative wS1 two-photon imaging through the surface grid. Left: Images 200 and 225 μm below the grids. Right: Cell ROIs at each depth. (C) The number of cells in each FOV across animals and the percent of touch-responsive cells in each FOV (see Materials and Methods; n = 4 animals, 18 total FOVs, 4156 total cell ROIs). (D) Representative C1 touch trial during simultaneous surface electrophysiology and 2P imaging (z = 225 μm). The traces correspond to the labeled electrodes in (B). The inset shows the traces immediately following touch. (E) 2P data analysis pipeline for detecting L2/3 neuronal ensembles and quantifying functional connectivity on a single-trial basis (see Materials and Methods and fig. S9). (F) Traveling wave spatial source points in a representative mouse during stimulation (early) and late response. Note that only the principal whisker is stimulated. (G) Differences in wave phase-gradient magnitude across timescales of the principal barrel (rank sum Wilcoxon test, 764 trials, n = 4 mice). (H to K) Quantified results from functional connectivity analysis (n = 4 animals, 22 FOVs, 250 total detected ensembles). (H) The total number of cells within each ensemble was unchanged for ensembles associated with the late wave or a weak late wave (rank sum Wilcoxon test). (I) The number of functional connections within the ensembles is higher for weak late wave trials, suggesting that increased sparsity supports the late wave (P < 0.001, rank sum Wilcoxon test). (J) The late wave ensembles show a significantly higher reactivation index. Randomly shuffling the calcium events abolishes the reactivation correlations (P < 0.001, Kruskal-Wallis with a post hoc Dunn-Sidak test). (K) The late wave ensemble shows consistently higher functional connectivity weights (P < 0.001, Kolmogorov-Smirnov test).
Fig. 6.
Fig. 6.. An E-I balanced model reproduces L2/3 sparsity through feedback wave-induced inhibitory stabilization.
(A) Schematic overviewing the spiking neural network stimulation and results. (B) Spontaneous L2/3 traveling wave LFP modeled on a 2 mm-by-4 mm patch of cortex. A t = 0 ms, a sensory stimulus and feedback inputs are exerted onto a small cortical patch (dotted square box). Notice how the wave changes as a function of time. (C) Zoom on a 100 μm-by-100 μm area of modeled cortex indicated by the dotted square box in (B) to show the responses of single cells during simulations with and without feedback. (D) Firing rate in the local network with and without feedback inputs. Feedback inputs during the wave decrease spiking activity in the local population (main), in contrast to the same network without feedback, which shows smaller fluctuations in spike rate (inset).
Fig. 7.
Fig. 7.. The late wave sharpens L5 dendritic calcium spikes.
(A) Schematic outlining the hypothesis that L5 dendrites contribute to the late wave. (B) Current source density (CSD) analysis and simultaneous NeuroGrid recordings in wS1 during C1 touch (left) and L5 optogenetic stimulation (right) for a representative animal. (C) Left: Schematic of the approach with baclofen. Middle: Average LFP across the grid from a representative animal. Baseline recordings (gray) and after baclofen injection (purple). Right: Late wave amplitudes during baseline recordings, a control ACSF injection, baclofen injection, and recovery after wash-out. Each data point is a grid channel [n = 5 animals, P < 0.0001, Friedman test with a post hoc Dunn-Sidak test; see fig. S13 (A to C) for more results]. (D) wS1 NeuroGrid recording during wMC silencing with muscimol abolishes the late wave. Each line indicates a single grid channel (n = 3 animals, P < 0.001, signed-rank Wilcoxon test). (E) Representative touch-evoked ΔF/F transients from an apical dendrite. (F) Simultaneous LFP recordings and L5 apical calcium transient detection. Top: Representative mean surface potential during C1 touch for a representative animal. Bottom: Dendritic calcium onset times across all animals (n = 3 animals, 238 total dendrites). (G) Left: Mean touch-evoked transients sorted into trials with and without a prominent late wave for a representative animal. Dendrites shown are the top 50th percentile of touch-responsive cells. Right: Histogram of the max dendritic ΔF/F slope times along for trials with and without a strong late wave (n = 3 animals; 238 total dendrites and 232 dendrites showed responses during late wave trials, and 157 dendrites showed responses during trials with a weak late wave). The average transient time between distributions is the same (P = 0.57). The SD of the late wave distribution is smaller (P < 0.001, rank sum Wilcoxon test following bootstrapping).

Update of

Similar articles

Cited by

References

    1. Aggarwal A., Brennan C., Luo J., Chung H., Contreras D., Kelz M. B., Proekt A., Visual evoked feedforward–feedback traveling waves organize neural activity across the cortical hierarchy in mice. Nat. Commun. 13, 4754 (2022). - PMC - PubMed
    1. Benigno G. B., Budzinski R. C., Davis Z. W., Reynolds J. H., Muller L., Waves traveling over a map of visual space can ignite short-term predictions of sensory input. Nat. Commun. 14, 3409 (2023). - PMC - PubMed
    1. Bhattacharya S., Brincat S. L., Lundqvist M., Miller E. K., Traveling waves in the prefrontal cortex during working memory. PLOS Comput. Biol. 18, e1009827 (2022). - PMC - PubMed
    1. Davis Z. W., Benigno G. B., Fletterman C., Desbordes T., Steward C., Sejnowski T. J., Reynolds J. H., Muller L., Spontaneous traveling waves naturally emerge from horizontal fiber time delays and travel through locally asynchronous-irregular states. Nat. Commun. 12, 6057 (2021). - PMC - PubMed
    1. Davis Z. W., Muller L., Martinez-Trujillo J., Sejnowski T., Reynolds J. H., Spontaneous travelling cortical waves gate perception in behaving primates. Nature 587, 432–436 (2020). - PMC - PubMed

LinkOut - more resources