. 2025 Feb 11;20(2):102396.
doi: 10.1016/j.stemcr.2024.102396. Epub 2025 Jan 30.

Effect of Notch1 signaling on muscle engraftment and maturation from pluripotent stem cells

Affiliations

Effect of Notch1 signaling on muscle engraftment and maturation from pluripotent stem cells

Aline M S Yamashita et al. Stem Cell Reports. .

Abstract

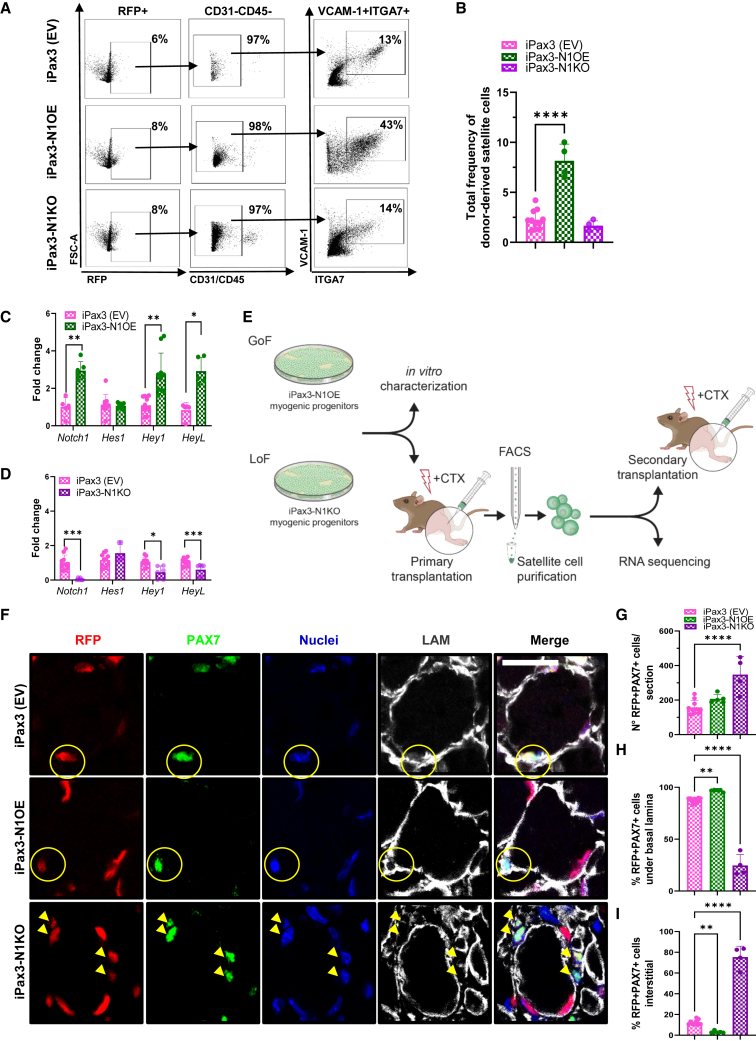
Pax3-induced pluripotent stem cell-derived myogenic progenitors display an embryonic molecular signature but become postnatal upon transplantation. Because this correlates with upregulation of Notch signaling, here we probed whether NOTCH1 is required for in vivo maturation by performing gain- and loss-of-function studies in inducible Pax3 (iPax3) myogenic progenitors. Transplantation studies revealed that Notch1 signaling did not change the number of donor-derived fibers; however, the NOTCH1 overexpression cohorts showed enhanced satellite cell engraftment and more mature fibers, as indicated by fewer fibers expressing the embryonic myosin heavy-chain isoform and more type IIX fibers. While donor-derived Pax7+ cells were detected in all transplants, in the absence of Notch1, secondary grafts exhibited a high fraction of these cells in the interstitial space, indicating that NOTCH1 is required for proper satellite cell homing. Transcriptional profiling of NOTCH1-modified donor-derived satellite cells suggests that this may be due to changes in the extracellular matrix organization, cell cycle, and metabolism.

Keywords: NOTCH1; Pax3; fiber type; muscle regeneration; myogenic progenitors; pluripotent stem cells; satellite cells; secondary transplantation.


Conflict of interest statement

Declaration of interests R.C.R.P. is the cofounder and holds equity in Myogenica.

Figures

Figure 1
Figure 1
Characterization of iPax3-N1OE and iPax3-N1KO myogenic progenitors (A and B) Schemes outline GoF (A) and LoF (B) studies in PSC-derived iPax3 myogenic progenitors. (C and D) Western blot for the intracellular domain (ICD) of NOTCH1 (120 kD), in iPax3-N1OE (C) and iPax3-N1KO (D) myogenic progenitors along with their respective iPax3 control counterparts. α/β-TUBULIN served as loading control (55 kD). These are representative images of three (iPax3-N1OE) and two (iPax3-N1OE) independent experiments. (E and F) Bar graphs show gene expression for Notch1 and downstream target genes: Hes1, Hey1, and HeyL in iPax3-N1OE (E) and iPax3-N1KO (F) myogenic progenitors along with iPax3 controls. Results are normalized to Gapdh. Data are shown as mean ± SEM of 3 independent experiments. ∗∗p < 0.01, ∗∗∗p < 0.001, and ∗∗∗∗p < 0.0001 by unpaired Student’s t test. (G–K) RNA sequencing analysis. (G) Principal component analysis for iPax3-N1OE (green) and iPax3 control (pink) shows the distribution of samples according to DEGs. (H) Heatmap representing hierarchical clustering of the top 1,454 DEGs shared among all samples. (I) Cluster 1 GO analysis. (J) Cluster 2 GO analysis. (K) GSE analysis with upregulated and downregulated KEGG pathways between iPax3 (EV) and iPax3-N1OE myogenic progenitors. (L and M) Bar graphs show gene expression for myogenic markers (L) and components of Notch1 signaling (M) in iPax3-N1OE and iPax3 controls. Data are shown as mean ± SEM of 4 and 3 independent experiments for iPax3 controls (magenta) and N1OE (green), respectively. p < 0.05, ∗∗p < 0.01, ∗∗∗p < 0.001, and ∗∗∗∗p < 0.0001 by ANOVA with Dunnett’s correction.
Figure 2
Figure 2
Myofiber engraftment upon the transplantation of iPax3-N1OE and iPax3-N1KO myogenic progenitors (A–D) Representative images show myofiber engraftment in muscles that had been transplanted with iPax3, iPax3-N1OE, and iPax3-N1KO myogenic progenitors. Scale bar, 500 μm. Staining for RFP in red and dystrophin (DYS) in white. DAPI-stained nuclei (A, C). Graph shows the area of RFP+DYS+ myofiber engraftment per muscle total area (B). Data are presented as mean ± SEM of two independent transplantation experiments (n = 16 TA muscles for iPax3 controls, n = 10 TAs for N1OE, and n = 6 TAs for N1KO). (D) Graph shows the frequency distribution of myofiber CSA area (n = 6 TAs for iPax3 controls, n = 3 TAs for N1OE, and n = 3 TAs for N1KO). p < 0.05 and ∗∗∗∗p < 0.0001 by ANOVA with Dunnett’s correction. (E and F) Representative images show staining for different MHC isoforms (AF647 signal, rendered in green), RFP (in red), and laminin (LAM, in white). Scale bar, 100 μm (F). Bar graphs show respective quantification (E), as the ratio between RFP+ engraftment area and MHC expression (n = 12 TAs for iPax3 controls, n = 6 TAs for N1OE, and n = 6 TAs for N1KO). p < 0.05, ∗∗∗p < 0.001, and ∗∗∗∗p < 0.0001 by ANOVA with Dunnett’s correction.
Figure 3
Figure 3
Satellite cell engraftment and function of iPax3-N1OE and iPax3-N1KO cells (A and B) Representative FACS plots show the frequency of donor-derived ITGA7+VCAM-1+ satellite cells gated from the RFP+ and CD31CD45 cell fractions in iPax3, iPax3-N1OE, and iPax3-N1KO muscle grafts (A). Graph shows the percentage of donor-derived RFP+CD31CD45-ITGA7+VCAM-1+ in the total MNC fraction (B). Data are presented as mean ± SEM of two independent experiments (n = 11 TAs for iPax3 controls, n = 4 TAs for N1OE, and n = 4 TAs for N1KO). ∗∗∗∗p < 0.0001 by ANOVA with Dunnett’s correction. (C and D) Bar graphs show gene expression for Notch1 and downstream target genes: Hes1, Hey1, and HeyL in iPax3-N1OE (C) and iPax3-N1KO (D) re-isolated satellite cells along with iPax3 controls. Results are normalized to Gapdh. Data are shown as mean ± SEM of two independent experiments (n = 5–10 TA muscles per sample). p < 0.05, ∗∗p < 0.01, and ∗∗∗p < 0.001 by unpaired Student’s t test. (E) Outline of secondary transplantation studies and characterization. (F–I) Satellite cell engraftment. (F) Representative images show donor-derived satellite cell engraftment in iPax3, iPax3-N1OE, and iPax3-N1KO secondary recipients. Staining for RFP in red, PAX7 in green, and laminin (LAM) in white. DAPI in blue stained nuclei. Yellow circles indicate RFP+PAX7+ cells under the basal lamina, while arrows indicate the presence of RFP+PAX7+ cells in the interstitial space. Scale bar, 50 μm. Graphs show quantification of the total number of RFP+PAX7+ cells per section (G) and the percentages of RFP+PAX7+ cells under the basal lamina (H) and at the interstitial (I) position. Data are presented as mean ± SEM of two independent experiments (n = 10 TAs for iPax3 controls, n = 5 TAs for N1OE, and n = 4 TAs for N1KO). ∗∗p < 0.01 and ∗∗∗∗p < 0.0001 by ANOVA with Dunnett’s correction.
Figure 4
Figure 4
Transcriptional signature of donor-derived iPax3-N1OE and iPax3-N1KO satellite cells (A) PCA plot of donor-derived satellite cells from iPax3 (EV) control (magenta), iPax3-N1OE (green), and iPax3-N1KO (purple) transplanted mice. (B) The same PCA with the inclusion of primary satellite cells (SCs, golden). (C) RNA sequencing hierarchical clustering of the top 2,398 DEGs shared between all samples. Clusters are indicated on the left margin. (D) Gene ontology analysis for cluster 2. (E) Gene ontology analysis for cluster 3. (F) GSE analysis with downregulated (down arrow) signaling pathways for iPax3 (EV) vs. N1OE. (G) Representative hierarchical clustering of most variable genes annotated for collagen degradation (n = 30 genes) and ECM organization (n = 60 genes) pathways. (H and I) Bar plots of gene expression levels for representative genes annotated to collagen degradation signaling (H) and ECM organization (I) pathways. Data are presented as mean ± SEM (n = 9 TAs for iPax3 in magenta, n = 4 TAs for N1OE in green, and n = 3 TAs for N1KO in purple). p < 0.05, ∗∗p < 0.01, and ∗∗∗p < 0.001 by ANOVA with Dunnett’s correction. (J) GSE analysis with downregulated (down arrow) signaling pathways for iPax3 vs. N1KO. (K) Representative hierarchical clustering of most variable genes annotated for TCA-ETC (n = 20 genes) and cell cycle (n = 20 genes) pathways. (L and M) Bar plots of gene expression levels for representative genes annotated to TCA-ETC (L) and cell cycle (M) pathways. iPax3 (magenta), N1OE (green), and N1KO (purple). Data are presented as mean ± SEM (n = 9 TAs for iPax3 in magenta, n = 4 TAs for N1OE in green, and n = 3 TAs for N1KO in purple). p < 0.05, ∗∗p < 0.01, ∗∗∗p < 0.001, and ∗∗∗∗p < 0.0001 by ANOVA with Dunnett’s correction.

References

    1. Abreu P., Garay B.I., Nemkov T., Yamashita A.M.S., Perlingeiro R.C.R. Metabolic Changes during In Vivo Maturation of PSC-Derived Skeletal Myogenic Progenitors. Cells. 2023;13 doi: 10.3390/cells13010076. - DOI - PMC - PubMed
    1. Artavanis-Tsakonas S., Rand M.D., Lake R.J. Notch signaling: cell fate control and signal integration in development. Science. 1999;284:770–776. doi: 10.1126/science.284.5415.770. - DOI - PubMed
    1. Azzag K., Bosnakovski D., Tungtur S., Salama P., Kyba M., Perlingeiro R.C.R. Transplantation of PSC-derived myogenic progenitors counteracts disease phenotypes in FSHD mice. NPJ Regen. Med. 2022;7:43. doi: 10.1038/s41536-022-00249-0. - DOI - PMC - PubMed
    1. Azzag K., Ortiz-Cordero C., Oliveira N.A.J., Magli A., Selvaraj S., Tungtur S., Upchurch W., Iaizzo P.A., Lu Q.L., Perlingeiro R.C.R. Efficient engraftment of pluripotent stem cell-derived myogenic progenitors in a novel immunodeficient mouse model of limb girdle muscular dystrophy 2I. Skelet. Muscle. 2020;10:10. doi: 10.1186/s13395-020-00228-3. - DOI - PMC - PubMed
    1. Baik J., Ortiz-Cordero C., Magli A., Azzag K., Crist S.B., Yamashita A., Kiley J., Selvaraj S., Mondragon-Gonzalez R., Perrin E., et al. Establishment of Skeletal Myogenic Progenitors from Non-Human Primate Induced Pluripotent Stem Cells. Cells. 2023;12 doi: 10.3390/cells12081147. - DOI - PMC - PubMed

Publication types

MeSH terms