. 2025 Feb 18;6(2):101935.
doi: 10.1016/j.xcrm.2025.101935. Epub 2025 Jan 30.

Integrative proteo-transcriptomic characterization of advanced fibrosis in chronic liver disease across etiologies

Affiliations

Integrative proteo-transcriptomic characterization of advanced fibrosis in chronic liver disease across etiologies

Hong Yang et al. Cell Rep Med. .

Abstract

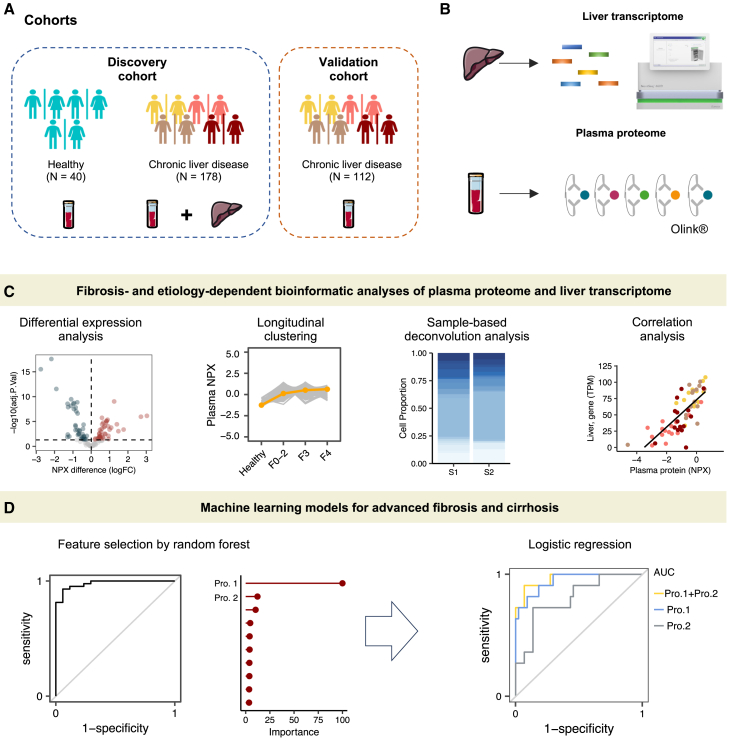
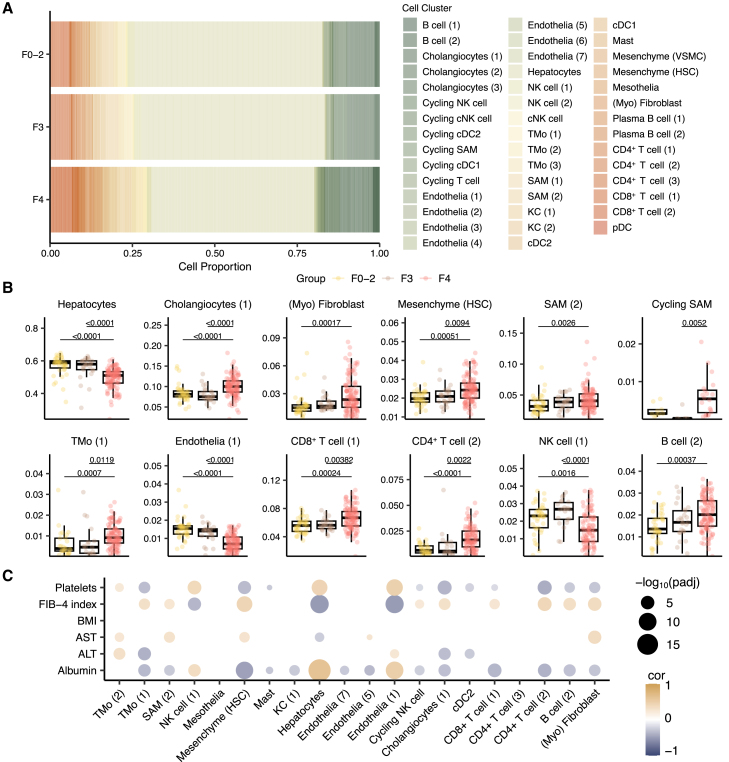
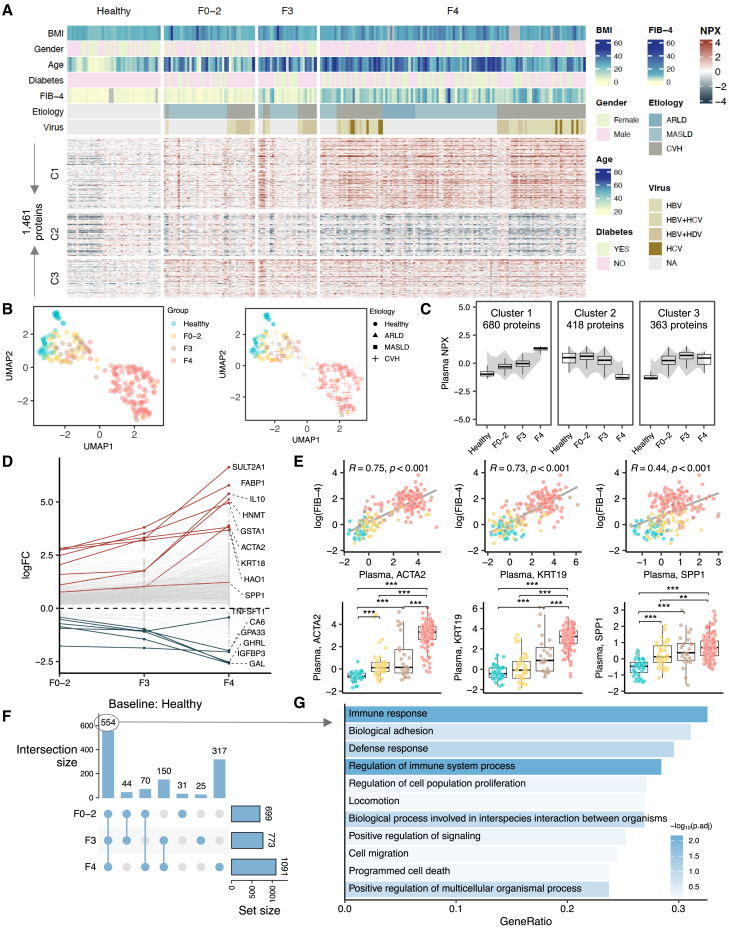
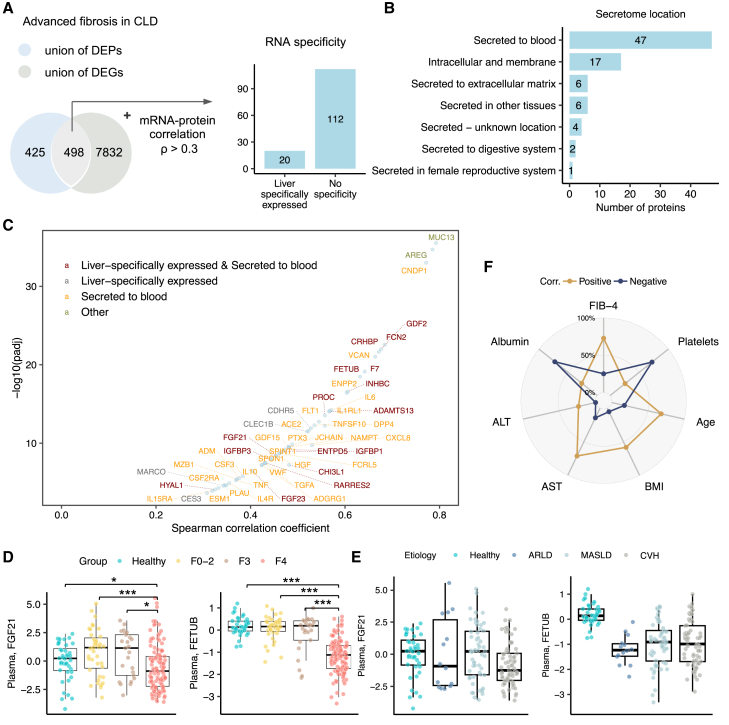
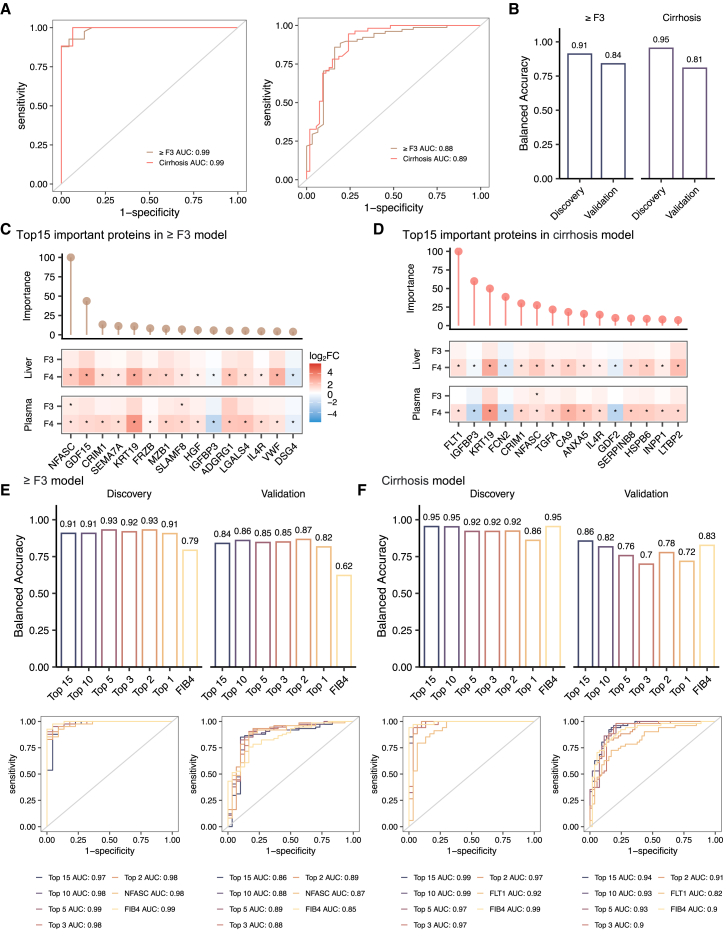
Chronic hepatic injury and inflammation from various causes can lead to fibrosis and cirrhosis, potentially predisposing to hepatocellular carcinoma. The molecular mechanisms underlying fibrosis and its progression remain incompletely understood. Using a proteo-transcriptomics approach, we analyze liver and plasma samples from 330 individuals, including 40 healthy individuals and 290 patients with histologically characterized fibrosis due to chronic viral infection, alcohol consumption, or metabolic dysfunction-associated steatotic liver disease. Our findings reveal dysregulated pathways related to extracellular matrix, immune response, inflammation, and metabolism in advanced fibrosis. We also identify 132 circulating proteins associated with advanced fibrosis, with neurofascin and growth differentiation factor 15 demonstrating superior predictive performance for advanced fibrosis(area under the receiver operating characteristic curve [AUROC] 0.89 [95% confidence interval (CI) 0.81-0.97]) compared to the fibrosis-4 model (AUROC 0.85 [95% CI 0.78-0.93]). These findings provide insights into fibrosis pathogenesis and highlight the potential for more accurate non-invasive diagnosis.

Keywords: chronic liver disease; liver fibrosis; multi-omics; non-invasive; systems biology.


Conflict of interest statement

Declaration of interests A.M., J.B., and M.U. are founders and shareholders of ScandiEdge and ScandiBio Therapeutics.

Figures

None
Graphical abstract
Figure 1
Figure 1
Study overview (A) Clinical cohorts. (B) Liver transcriptome sequencing was carried out on liver tissue from 178 patients with CLD (n = 144) or CLD and HCC (n = 34). Proximity extension assay-based proteomics technology was used to profile plasma samples from 330 subjects in the studied cohorts, totaling 1,463 proteins quantified. (C) Schematic representation of the bioinformatics workflow of this study, including statistical, functional, correlation, and single-cell deconvolution analyses on omics profiles. (D) Machine-learning-based classification models were used to identify potential biomarkers for advanced fibrosis and cirrhosis. Abbreviations: NPX, normalized protein expression; CLD, chronic liver disease; HCC, hepatocellular carcinoma; logFC, log fold change; AUC, area under the curve; Pro., protein; F, fibrosis; F0–2, fibrosis stage 0/1/2; S, sample.
Figure 2
Figure 2
Transcriptomic signature differentiates advanced fibrosis (A) Flow diagram illustrating the number of liver tissue samples from either CLD or peritumoral CLD, categorized by each etiology and the respective histologically assessed stages of fibrosis. (B) A UMAP analysis was performed on transcriptomics data from hepatic tissues (F0–2, n = 39; F3, n = 25; F4, n = 114). Each data point represents a sample in the respective colored group. (C) Dot-heatmap showing the top significantly regulated Kyoto Encyclopedia of Genes and Genomes (KEGG) pathways in hepatic tissue with advanced fibrosis compared to those in F0/1/2 stages (Benjamini and Hochberg false discovery rate adjusted p value < 0.05), see the full list in Data S2. (D) Dot-heatmap showing the top transcription factors significantly enriched by target gene sets changed in advanced fibrotic tissue as compared to those in F0/1/2 stages (Benjamini and Hochberg false discovery rate adjusted p value < 0.05), see the full list in Data S2. (E) Venn diagram showing the number of differentially expressed genes (DEGs) (Benjamini and Hochberg false discovery rate adjusted p values < 0.05) in advanced fibrotic tissue as compared to those in the F0/1/2 stages. (F) Heatmap showing the relative expression of fibrosis marker genes in hepatic tissues with advanced fibrosis compared to those in F0/1/2 stages. (G) A UMAP analysis was performed on transcriptomics data from cirrhotic tissues resulting from different etiologies, including ARLD (n = 14), MASLD (n = 42), and CVH (n = 58). (H) The number of differentially expressed genes shared among pairwise comparisons across three etiologies. Abbreviations: UMAP, uniform manifold approximation and projection; HCC, hepatocellular carcinoma; CLD, chronic liver disease; CVH, chronic viral hepatitis; MASLD, metabolic dysfunction-associated liver disease; ARLD, alcohol-related liver disease; EMT, epithelial-to-mesenchymal transition; MSCs, mesenchymal stem cells; HSCs, hepatic stellate cells.
Figure 3
Figure 3
Single-cell deconvolution reveals heterogeneity in cell type composition and its association with fibrosis score (A) Barplot showing the estimated cell population from bulk RNA sequencing data from hepatic tissues. (B) Boxplots showing the significantly differentiated cell populations in groupwise comparisons. Adjusted p values were derived from Kruskal-Wallis’s test followed by the Dunnett post hoc pairwise test. The boxplots represent the interquartile range (IQR), with the horizontal line indicating the median. (C) Spearman coefficient correlation between the estimated cell proportion and clinical measurements. The size and color of the dots are proportional to the statistical significance indicated by the negative log10 of adjusted p values using Benjamini and Hochberg false discovery rate and correlation coefficient, respectively. Adjusted p value < 0.05 was considered as statistical significance. Abbreviations: KCs, Kupffer cells; pDCs, plasmacytoid dendritic cells; HSCs, hepatic stellate cells; VSMCs, vascular smooth muscle cells; cDCs; conventional dendritic cells; SAMs, scar-associated macrophages; TMo, tissue monocytes; cNKs, cytotoxic natural killer cells.
Figure 4
Figure 4
Plasma proteomic changes in patients with liver disease reflect disease severity (A) Plasma proteins profiling of subjects in the discovery cohort. The rows of heatmap were split based on the fuzzy cluster to which a protein belongs to. The columns of heatmap were split based on the group to which a sample belongs to. The column is annotated based on clinical and biochemical parameters of the sample. B) UMAP analyses were performed on the proteome obtained from subjects in the discovery cohort. Each data point represents a sample in the respective colored group. (C) Fuzzy clustering identified three protein clusters with distinct abundance patterns corresponding to disease severity. The individual gray line represents the median abundance of individual proteins in the cluster, and the boxplot represents the median, quartile values for all proteins in the cluster across different groups. (D) Log transformation of fold change (logFC) of top 5 proteins in each groupwise comparison. (E) Spearman correlation between fibrosis markers (ACTA2, KRT19, and SPP1) and fibrosis score (fibrosis-4, FIB-4) (upper) and their plasma levels across groups (lower). ∗adjusted p value < 0.05, ∗∗adjusted p value < 0.01, ∗∗∗adjusted p value < 0.001 derived from DESeq2. The boxplots represent the interquartile range (IQR), with the horizontal line indicating the median. (F) Upset plot summarizing the numbers of proteins with levels significantly different in patients compared to healthy subjects. (G) The biological processes enriched in the common set of differentially expressed proteins across comparisons.
Figure 5
Figure 5
Integrative analysis of liver and plasma omics profiles (A) Venn diagram showing the intersection between the union of DEPs and DEGs associated with advanced fibrosis. (B) The secretome location is predicted for filtered proteins according to the annotation in Human Protein Atlas.. (C) Spearman correlation between the levels of mRNA-protein for filtered proteins. (D and E) (D) Boxplot showing the plasma levels of FGF21 and FETUB in fibrosis-based groups and (E) in etiology-based groups. ∗adjusted p value < 0.05, ∗∗adjusted p value < 0.01, ∗∗∗adjusted p value < 0.001 derived from DESeq2. This boxplots represent the interquartile range (IQR), with the horizontal line indicating the median. (F) Radar plot showing the proportion of proteo-transcriptome signature proteins that are positively or negatively correlated with clinical parameters, including FIB-4, albumin, platelets, AST, ALT, BMI, and age. Abbreviations: DEPs, differentially expressed proteins; DEGs, differentially expressed genes.
Figure 6
Figure 6
Biomarker panels for advanced fibrosis and cirrhosis (A and B) The AUC-ROC curves (A) and balanced accuracy (B) for prediction of advanced fibrosis (≥F3 model) and cirrhosis (≥F4 model) in discovery and validation cohorts using random forest algorithms based on plasma proteins. (C and D) Top 15 important proteins identified by random forest algorithm from the ≥F3 (C) and cirrhosis (D) models, respectively. The bar on the top of each plot shows the importance of the protein in the respective model. The heatmap on the bottom shows the relative changes (log2 fold change) of hepatic mRNA and plasma protein in advanced fibrosis as compared to those in the F0/1/2 stages. ∗adjusted p value < 0.05. (E and F) The AUC-ROC curves and balanced accuracy for the prediction of advanced fibrosis (E) and cirrhosis (F) based on the top 15, top 10, top 5, top 3, and top 2, the first important proteins in both discovery and validation cohorts using logistic regression algorithm.

References

    1. Asrani S.K., Kouznetsova M., Ogola G., Taylor T., Masica A., Pope B., Trotter J., Kamath P., Kanwal F. Increasing Health Care Burden of Chronic Liver Disease Compared With Other Chronic Diseases, 2004-2013. Gastroenterology. 2018;155:719–729.e4. doi: 10.1053/j.gastro.2018.05.032. - DOI - PubMed
    1. Moon A.M., Singal A.G., Tapper E.B. Contemporary Epidemiology of Chronic Liver Disease and Cirrhosis. Clin. Gastroenterol. Hepatol. 2020;18:2650–2666. doi: 10.1016/j.cgh.2019.07.060. - DOI - PMC - PubMed
    1. Man S., Deng Y., Ma Y., Fu J., Bao H., Yu C., Lv J., Liu H., Wang B., Li L. Prevalence of Liver Steatosis and Fibrosis in the General Population and Various High-Risk Populations: A Nationwide Study With 5.7 Million Adults in China. Gastroenterology. 2023;165:1025–1040. doi: 10.1053/j.gastro.2023.05.053. - DOI - PubMed
    1. Younossi Z.M., Stepanova M., Younossi Y., Golabi P., Mishra A., Rafiq N., Henry L. Epidemiology of chronic liver diseases in the USA in the past three decades. Gut. 2020;69:564–568. doi: 10.1136/gutjnl-2019-318813. - DOI - PubMed
    1. Hammerich L., Tacke F. Hepatic inflammatory responses in liver fibrosis. Nat. Rev. Gastroenterol. Hepatol. 2023;20:633–646. doi: 10.1038/s41575-023-00807-x. - DOI - PubMed

LinkOut - more resources