

A practical work around for breast density distribution discrepancies between mammographic images from different vendors
- PMID: 39890617
- PMCID: PMC12226699
- DOI: 10.1007/s00330-025-11383-w
A practical work around for breast density distribution discrepancies between mammographic images from different vendors
Abstract
Objectives: Investigate the impact of mammography device grouped by vendor on volumetric breast density and propose a method that mitigates biases when determining the proportion of high-density women.
Materials and methods: Density grade class and volumetric breast density distributions were obtained from mammographic images from three different vendor devices in different centers using breast density evaluation software in a retrospective study. Density distributions were compared across devices with a Mann-Whitney U test and breast density thresholds corresponding to distribution percentiles calculated. A method of matching density percentiles is proposed to determine women at potentially high risk while mitigating possible bias due to the device used for screening.
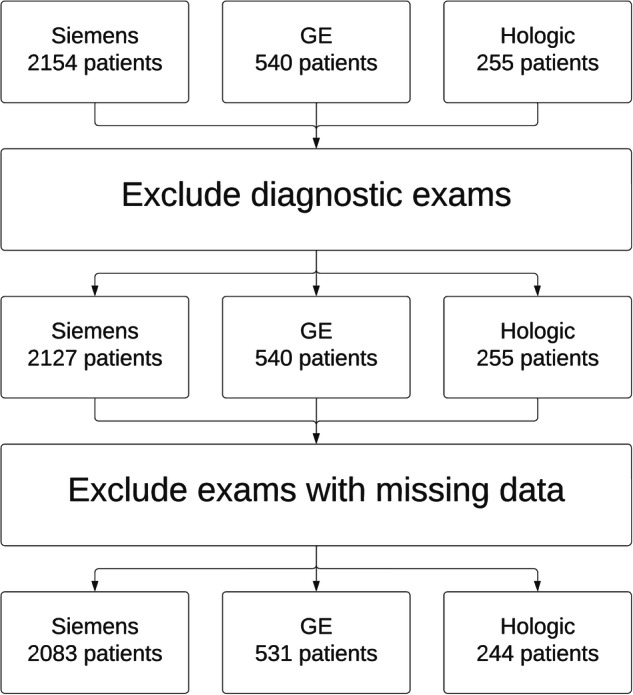
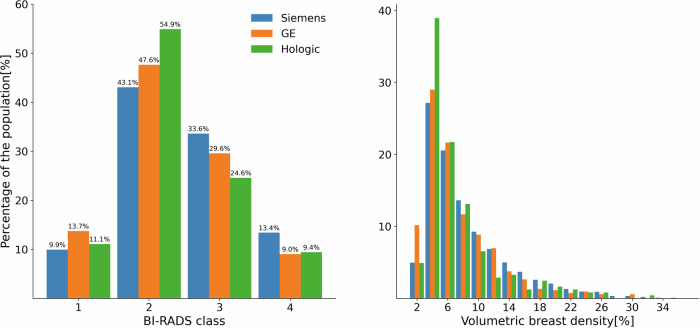
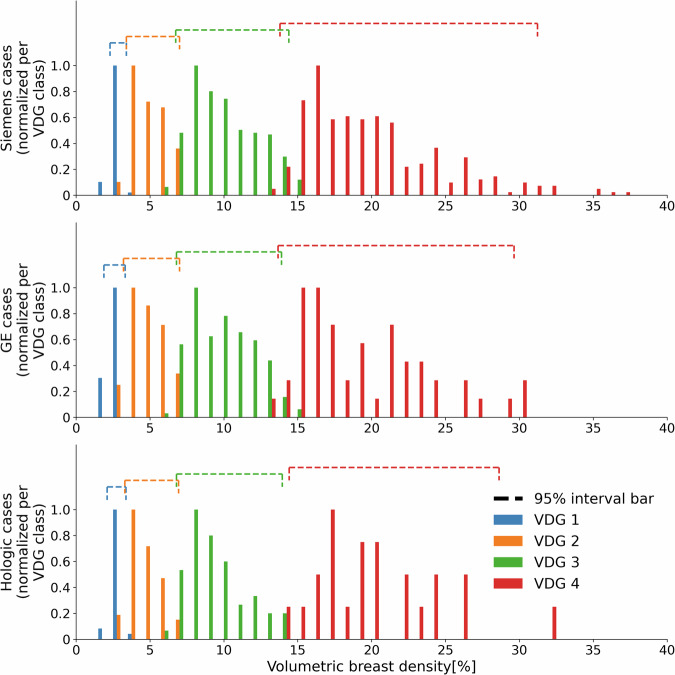
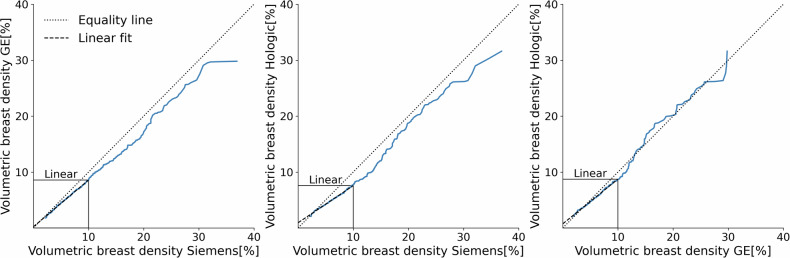
Results: 2083 (mean age 59 ± 5.4), 531 (mean age 58.8 ± 5.7) and 244 (mean age 60.7 ± 6.0) screened women were evaluated on three vendor devices, respectively. Both the density grade distribution and the volumetric breast density were different between Vendor 1 and Vendor 2 data (p < 0.001) and between Vendor 1 and Vendor 3 data (p < 0.001). Between Vendor 2 and Vendor 3, no significant difference was observed (p = 0.67 for density grade, p = 0.29 for volumetric density). To recruit the top 10% of women with extremely dense breasts required respective density thresholds of 16.1%, 13.6% and 13.8% for the three vendor devices.
Conclusion: Density grade class and volumetric breast density distributions differ between devices grouped by vendor and can result in statistically different breast density distributions. Percentile-dependent density thresholds can ensure unbiased selection of high-risk women.
Key points: Question Does the use of x-ray systems from different vendors influence breast density evaluation and the resulting selection of high-risk women during breast cancer screening? Findings Statistically significant differences were observed between breast density distributions of different vendors; a method of matching via percentiles is proposed to prevent biased density evaluations. Clinical relevance Measured breast density distributions differed between X-ray devices. A workaround is proposed that determines density thresholds corresponding to a specified population, allowing the same proportion of women to be selected with a density algorithm.
Keywords: Breast density; Breast neoplasms; Early detection of cancer; Mammography.
© 2025. The Author(s).
Conflict of interest statement
Compliance with ethical standards. Guarantor: The scientific guarantor of this publication is Prof. Dr. Hilde Bosmans. Conflict of interest: The authors of this manuscript declare no relationships with any companies, whose products or services may be related to the subject matter of the article. Statistics and biometry: No complex statistical methods were necessary for this paper. Informed consent: Written informed consent was waived by the Institutional Review Board. Ethical approval: Institutional Review Board approval was obtained. Study subjects or cohorts overlap: No study subjects or cohorts have been previously reported. Methodology: Retrospective Cross-sectional study Multicenter study
Figures
References
MeSH terms
Grants and funding
LinkOut - more resources
Full Text Sources
Medical
