. 2025 Jan 31;16(1):1218.
doi: 10.1038/s41467-025-56273-3.

STICI: Split-Transformer with integrated convolutions for genotype imputation

Affiliations

STICI: Split-Transformer with integrated convolutions for genotype imputation

Mohammad Erfan Mowlaei et al. Nat Commun. .

Abstract

Despite advances in sequencing technologies, genome-scale datasets often contain missing bases and genomic segments, hindering downstream analyses. Genotype imputation addresses this issue and has been a cornerstone pre-processing step in genetic and genomic studies. Although various methods have been widely adopted for genotype imputation, it remains challenging to impute certain genomic regions and large structural variants. Here, we present a transformer-based framework, named STICI, for accurate genotype imputation. STICI models automatically learn genome-wide patterns of linkage disequilibrium, evidenced by much higher imputation accuracy in regions with highly linked variants. Our imputation results on the human 1000 Genomes Project and non-human genomes show that STICI can achieve high imputation accuracy comparable to the state-of-the-art genotype imputation methods, with the additional capability to impute multi-allelic variants and various types of genetic variants. STICI can be trained for any collection of genomes automatically using self-supervision. Moreover, STICI shows excellent performance without needing any special presuppositions about the underlying patterns in collections of non-human genomes, pointing to adaptability and applications of STICI to impute missing genotypes in any species.


Conflict of interest statement

Competing interests: The authors declare no competing interests.

Figures

Fig. 1
Fig. 1. Two categories of genotypes missingness.
a Sporadic missingness: It arises due to genotype calling errors and assay failures. Prediction of sporadic missingness is typically done during the pre-phasing step of imputation pipelines. b Systematic missingness: Differences in sequencing resolution are common causes of systematic missingness because a subset of genomic positions are assayed. The inference of missing variants in untyped regions is a major focus of imputation pipelines.
Fig. 2
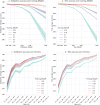
Fig. 2. Average accuracy over 3-fold cross-validation for validation and test sets in the HLA dataset using different masking rate (MaskR) values during STICI training.
Bars indicate a 95% confidence interval per experiment. a, b A breakdown of average accuracy for various missing rate (MissR) values of validation/test set when the model is trained using different MaskR values. The patterns show that a model trained using a higher MaskR is more robust across different target MissRs. c, d Average accuracy for validation/test sets over 3 folds and different MissR values calculated for various LD bins. The trend suggests that a higher MaskR increases the performance across LD bins, which could be attributed to the impact of MaskR on STICI to learn LD patterns comprehensively. When MaskR is low, STICI imputations do not benefit from the LD patterns present and thus, STICI does not learn the majority of pairwise correlations (LD) among the variants. Consequently, STICI is not able to infer the missing value using all possible information in the respective LD block of the target variant. Source data are provided as a Source Data file.
Fig. 3
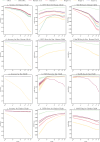
Fig. 3. MAF and LD distributions of benchmark datasets from the 1000 Genomes Project.
MAF and maximum LD distributions are presented using kernel density estimation plots for SNVs and SVs in (a). HLA region on chromosome 6, (b) deletions in chromosome 22, (c) SVs in chromosome 22, (e) SVs in chromosome 6, (f) SVs in chromosome 10, (g) SVs in chromosome 16, and (h) SVs in chromosome 20. Overall, SVs exhibit a low LD value, posing a significant challenge to imputation methods. Plot (d) LD among different SV types in chromosome 22 shows that structural events are commonly correlated with deletions. Furthermore, deletion, copy number variation, and duplication events appear in different ranges of LD, while the rest of the events are limited to LD ≤ 0.1. Lastly, the majority of correlated SVs to deletions are of the same event, making deletions a good separate dataset for our experiment. Source data are provided as a Source Data file.
Fig. 4
Fig. 4. Comparison sporadic imputation results of competing methods across SV types.
Average R2 of ground-truth genotypes in the test sets and respective predictions over 3-fold cross-validations on chromosomes 6, 10, 16, and 20. The experiments are performed on each chromosome separately, and the results are averaged over chromosomes and folds. Vertical lines indicate standard deviations. The improvement plot shows the R2 score difference between STICI and the best of other methods, normalized by the best R2 scores for each SV type. We only report biallelic imputation results for SHAPEIT5 because we faced issues with imputing normalized multi-allelic variants using this software. Source data are provided as a Source Data file.
Fig. 5
Fig. 5. Systematic missingness imputation results across different datasets.
The results for each dataset is arranged in one row (human Chr22 in (ac), simulated human Chr19 in (df), rat Chr20 in (gi), Sasso chicken Chr20 in (jl)). The columns from left to right respectively contain accuracy, INFO score, and MaCH-Rsq results. The lines show the average of the metrics, while the bars around each line indicate a 95% confidence interval. Source data are provided as a Source Data file.
Fig. 6
Fig. 6. The architecture of STICI.
a Overall pipeline of the proposed framework: the data is separated into paternal and maternal haplotypes in the case of diplotypes, and it remains the same for haplotypes. While the figure shows phased genotypes, STICI can handle unphased data as well (though the performance degrades). Next, the data is one-hot encoded and fed into our Cat-Embedding layer, followed by splitting the data vertically into k chunks. The chunks overlap in order to capture information for the SNVs residing around the chunks' edges. Each branch passes through a unique set of attention, convolution, and fully connected layers. In the self-attention block, the flanking variants that come from the neighboring chunks are removed after applying multi-head attention. Finally, the results of all branches are assembled to generate the final sequence. b The workflow of proposed Categorical Embedding: we consider a unique vector space for each unique categorical value in each SNV/feature. To save computational resources, instead of pre-allocating these vectors, we use the addition of positional embedding and categorical value embeddings in order to generate unique embedding vectors for each categorical value in each SNV/feature. We consider a missing (or masked) value as another categorical value (allele) in our model. Here, 2 (highlighted in red) represents the missing value. c Convolution blocks: two parallel convolutional branches with varying kernel sizes are used in our convolution blocks. These multi-scale convolutional blocks allow STICI to capture information at multiple spatial scales in the input data, similar to the pattern-matching idea used in classical computer vision methods using convolution. Given the variable sizes of LD blocks, multi-scaled convolution is expected to excel at capturing LD patterns compared to single-scaled convolutions.

Similar articles

Cited by

References

    1. Lewis, C. M. & Vassos, E. Polygenic risk scores: from research tools to clinical instruments. Genome Med.12, 1–11 (2020). - PMC - PubMed
    1. Torkamaneh, D., Belzile, F. Accurate imputation of untyped variants from deep sequencing data. Methods Mol. Biol. 271–281 10.1007/978-1-0716-1103-6_13 (2021). - PubMed
    1. Song, M. et al. An autoencoder-based deep learning method for genotype imputation. Front. Artif. Intell.5, 10.3389/frai.2022.1028978 (2022). - PMC - PubMed
    1. Das, S., Abecasis, G. R. & Browning, B. L. Genotype imputation from large reference panels. Annu. Rev. Genomics Hum. Genet.19, 73–96 (2018). - PubMed
    1. Graffelman, J., Nelson, S., Gogarten, S. & Weir, B. Exact inference for hardy-weinberg proportions with missing genotypes: Single and multiple imputation. G35, 2365–2373 (2015). - PMC - PubMed

LinkOut - more resources