. 2025 Jan 31;16(1):1214.
doi: 10.1038/s41467-024-54809-7.

NSm is a critical determinant for bunyavirus transmission between vertebrate and mosquito hosts

Affiliations

NSm is a critical determinant for bunyavirus transmission between vertebrate and mosquito hosts

Selim Terhzaz et al. Nat Commun. .

Abstract

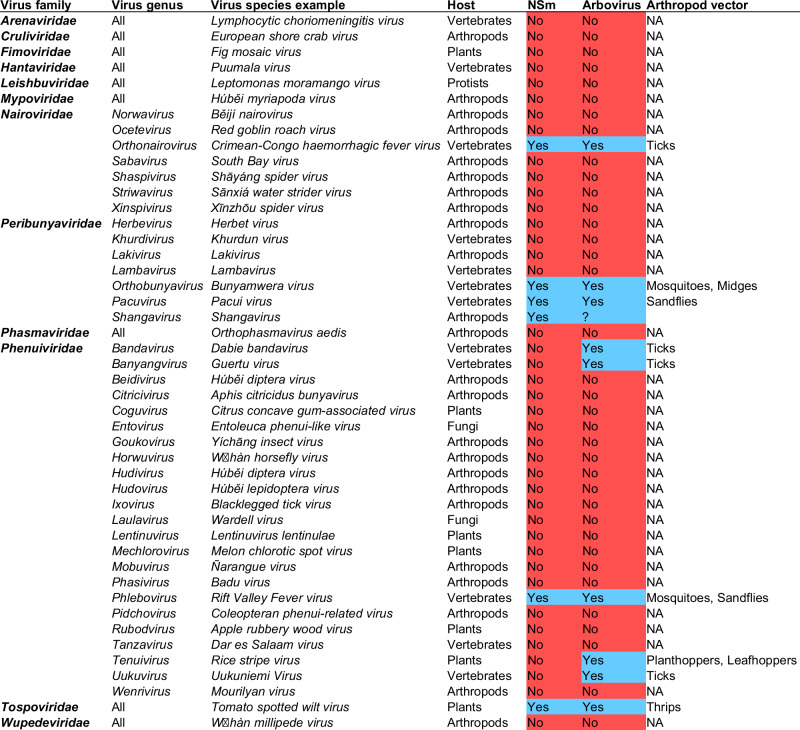
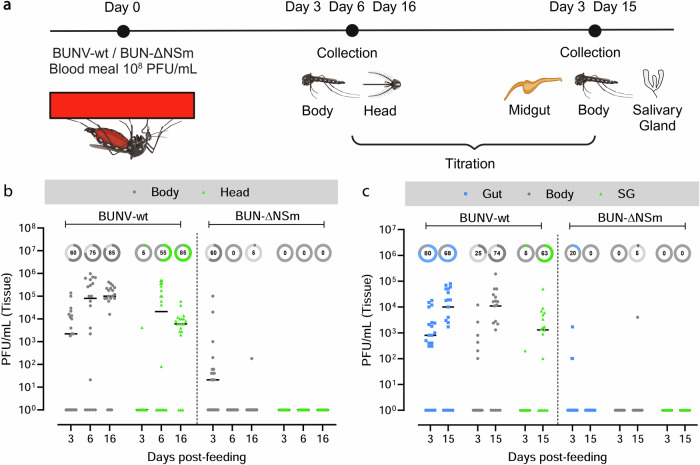
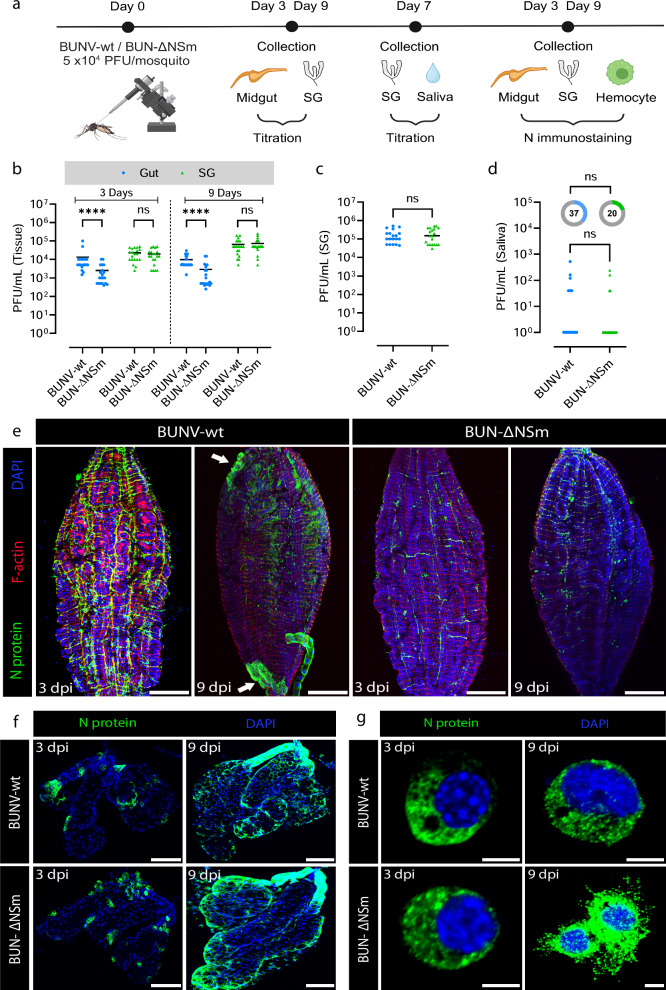
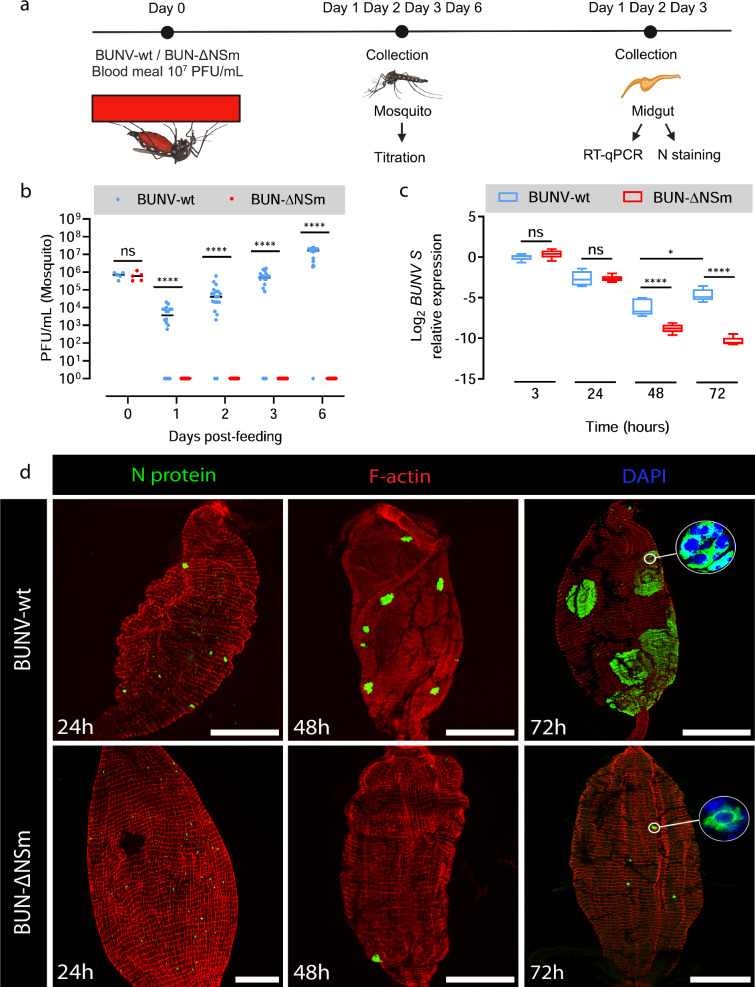
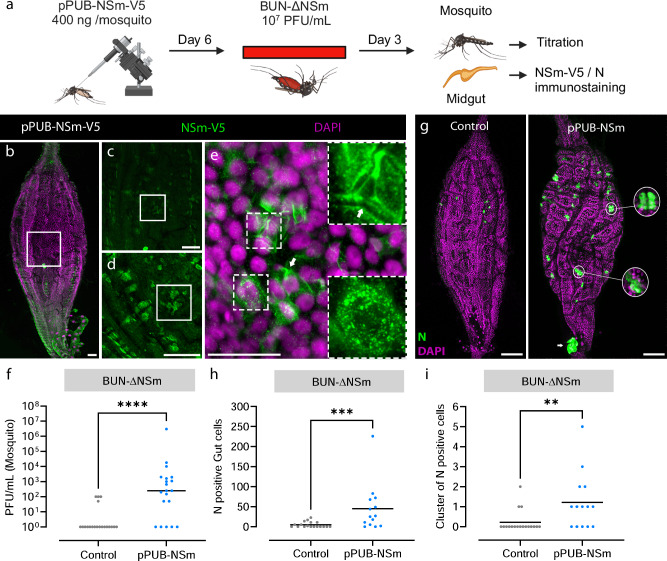
Bunyavirales is a very large order including viruses infecting a variety of taxonomic groups such as arthropods, vertebrates, plants, and protozoa. Some bunyaviruses are transmitted between vertebrate hosts by blood-sucking arthropods and cause major diseases in humans and animals. It is not understood why only some bunyaviruses have evolved the capacity to be transmitted by arthropod vectors. Here we show that only vector-borne bunyaviruses express a non-structural protein, NSm, whose function has so far remained largely elusive. Using as experimental system Bunyamwera virus (BUNV) and its invertebrate host, Aedes aegypti, we show that NSm is dispensable for viral replication in mosquito cells in vitro but is absolutely required for successful infection in the female mosquito following a blood meal. More specifically, NSm is required for cell-to-cell spread and egress from the mosquito midgut, a known barrier to viral infection. Notably, the requirement for NSm is specific to the midgut; bypassing this barrier by experimental intrathoracic infection of the mosquito eliminates the necessity of NSm for virus spread in other tissues, including the salivary glands. Overall, we unveiled a key evolutionary process that allows the transmission of vector-borne bunyaviruses between arthropod and vertebrate hosts.


Conflict of interest statement

Competing interests: The authors declare no competing interests.

Figures

Fig. 1
Fig. 1. Correlation between bunyaviruses vectored by arthropods and the presence of NSm.
Analysis of the presence (highlighted in blue) or absence (highlighted in red) of NSm across all families and genera within the Bunyavirales order. Arboviruses are highlighted in blue and bunyaviruses which are not arboviruses are highlighted in red. Primary host taxonomic group is shown in addition to the vector host for arboviruses. Shangavirus encodes a putative NSm, but biology and host specificity of this virus is unknown. Phleboviruses (e.g., Rift Valley Fever virus) also encode P78, which is processed from the glycoprotein precursor initiated from the first start codon of the M segment and covers both NSm and Gn coding region. Data were collected from the International Committee on Taxonomy of Viruses (https://ictv.global/taxonomy).
Fig. 2
Fig. 2. Effect of NSm deletion on infection and dissemination following oral feeding.
a Experimental scheme for the analysis of BUNV-wt and BUN-ΔNSm infection dynamics (Created in BioRender. Terhzaz, S. (2024) https://BioRender.com/o44x482). Ae. aegypti were fed with a blood meal containing 4 × 108 PFU/mL of BUNV-wt or BUN-ΔNSm. Virus titres were measured by plaque assay on BHK-21 cells. b BUNV-wt or BUN-ΔNSm titres in bodies and heads at 3-, 6- and 16-days post-blood meal (dpbm). c BUNV-wt or BUN-ΔNSm titres in guts, bodies, and salivary glands (SG) at 3 and 15 dpbm. Titres are displayed as PFU/mL for each tissue with individual samples displayed (n = 20 per condition). All samples are presented in the graph. Lines indicate median values and the circled numbers represent the percentage of infected samples for each condition. Source data are provided as a Source Data file.
Fig. 3
Fig. 3. Effect of NSm deletion on infection, dissemination and transmission following injection in Ae. aegypti.
a Experimental scheme for the analysis of BUNV-wt and BUN-ΔNSm infection dynamics (Created in BioRender. Terhzaz, S. (2024) https://BioRender.com/s57y407). b Virus titres in midguts and salivary glands (SG) at 3 and 9 days after BUNV-wt or BUN-ΔNSm exposure by intrathoracic injection (5 × 104 PFU/mosquito). Virus titres were measured by plaque assay on BHK-21 cells. Titres are displayed as PFU/mL for each tissue with individual samples displayed (n = 20 per condition). Statistical significance shown on the graph was obtained using a two-way ANOVA followed by a Tukey’s multiple comparisons test. ns, not significant, p value > 0.5; ****p value < 0.0001. Adult females were inoculated intrathoracically with 5 × 104 PFU/mosquito of BUNV-wt (n = 19) or BUN-ΔNSm (n = 20) and virus titres of individual salivary glands (c) and saliva (d) quantified at 7 dpi by plaque assay on BHK-21 cells. Viral titres were analysed by a two-tailed Mann-Whitney test and the infection prevalence was analysed with a Chisquare test. ns = not significant. All the samples are presented in the graph. Lines indicate median values and the circled numbers represent the percentage of infected mosquitoes. Infection prevalence for the saliva were not different (p = 0.25). Midguts (e) and salivary glands (f) were dissected at 3 and 9 dpi and stained with anti-N recognizing the viral nucleocapsid N protein (green), Phalloidin Texas Red to visualize F-actin filaments (red) and with DAPI to visualize nuclei (blue). Images are merged z-stacks. Scale bars are 150 µm for (e) and 100 µm for (f). g Circulating hemocyte cells perfused from mosquitoes at 3 and 9 dpi and stained with DAPI to visualize nuclei (blue), and with anti-N (green). Scale bars are 10 µm. Source data are provided as a Source Data file.
Fig. 4
Fig. 4. Infection pattern of BUNV-wt and BUN-ΔNSm in whole female Ae. aegypti and midguts.
a Experimental scheme for the analysis of BUNV-wt and BUN-ΔNSm infection dynamics (Created in BioRender. Terhzaz, S. (2024) https://BioRender.com/h11o587). b BUNV-wt or BUN-ΔNSm titres in mosquitoes at 0 h and 1, 2, 3 and 6 dpbm fed with a blood meal containing 2 × 107 PFU/mL of virus. Virus titres were measured by plaque assay on BHK-21 cells and are displayed as PFU/mL for each animal with individual samples displayed (n = 5 per condition for 0 h, n = 16–20 per condition for 1, 2, 3 and 6 dpbm). Statistical significance shown on the graph was obtained using a two-way ANOVA followed by a Tukey’s multiple comparisons test. ns, not significant, p value > 0.5; ****p value < 0.0001. c BUNV S RNA levels in the midgut at 3, 24, 48 and 72 h pbm were quantified by RT-qPCR. Normalised expression for each sample was obtained as described, normalised to the S7 ribosomal gene and as relative values to that of the control group (BUNV-wt 3 h, RQ geomean set to 1). Log2-transformed RQ values were plotted (n = 5 pools of 4 midguts per group and time point). Box plots display the RQ minimum, first quartile, median, third quartile, and maximum. Statistical testing by two-way ANOVA followed by a Tukey’s multiple comparisons test. *p = 0.0225; ****p value < 0.0001. d Mosquitoes were fed with blood containing 7 × 107 PFU/mL of BUNV-wt or BUN-ΔNSm. Midguts were dissected at 24, 48 and 72 h pbm and stained with anti-N (green), F-actin filaments (red) and with DAPI to visualize nuclei (blue). Representative images are merged z-stacks. High-magnification images of the circled area showing individual or group of cells. Scale bars are 150 µm. Source data are provided as a Source Data file.
Fig. 5
Fig. 5. In trans expression of NSm rescues BUN-ΔNSm infection in Ae. aegypti.
a Workflow diagram of in vivo transfection and infection (Created in BioRender. Terhzaz, S. (2024) https://BioRender.com/f07u252). Mosquitoes were transfected with the plasmid pPUb-NSm-V5, or not transfected (controls), and fed at 6 dpi with a blood meal containing 7 x 107 PFU/mL of BUN-ΔNSm, and then assessed by immunostaining and titration. Midguts were dissected at 6 dpi and stained with anti-V5 to detect the V5-tagged NSm protein (green), and with DAPI to visualize nuclei (magenta). Images show a representative midgut and are maximum projection of confocal z-series taken at (b) 5x, (c) 10x, (d) 20x and (e) 40x magnifications. Panel (e) contains additional dashed boxed areas to illustrate the cytoplasmic NSm punctate staining as well as the plasma membrane of midgut epithelial cells (arrow). Scale bars are 50 µm. f Virus titres of whole mosquitoes at 3 dpbm were determined by plaque assay on BHK-21 cells and displayed as PFU/mL with all individual animals that were infected displayed (n = 20 per condition). Lines indicate median values. Statistical testing by two-tailed Mann-Whitney test for viral titres. ****p value < 0.0001. Statistical analysis of the infection prevalence for controls (20 %) and pPUb-NSm-V5 (75 %) was performed using a Chisquare test. ***p = 0.0006. gi Mosquitoes were microinjected with the recombinant plasmid pPUb-NSm, or not (controls), and fed at 6 dpi with a blood meal containing 2 x 108 PFU/mL of BUN-ΔNSm. g Merged z-stack representative images of midguts stained at 6 dpbm with an N antibody (green) and DAPI (magenta). Scale bars are 150 µm. Quantification of individual (h) or cluster of ( ≥ 3 cells/foci, (i) N positive cells per midgut of infected female mosquitoes (n = 18 and 14 for controls and pPUb-NSm respectively) at 3 dpbm. Lines indicate mean values. Statistical testing by two-tailed Mann-Whitney test. **p value = 0.006 and ***p value = 0.001. Source data are provided as a Source Data file.
Fig. 6
Fig. 6. High doses of BUN-ΔNSm viruses do not impact dissemination in Ae. aegypti.
a Workflow diagram (Created in BioRender. Terhzaz, S. (2024) https://BioRender.com/s43c481). b Mosquitoes were fed with 2 × 107, 7 × 107 or 2 x 108 PFU/mL of either BUNV-wt and BUN-ΔNSm, and virus titres determined. Titres are displayed as PFU/mL for each whole individual female (n = 20 per condition). Statistical significance shown on the graph was obtained using a two-way ANOVA followed by a Tukey’s multiple comparisons test. ns, not significant, p value > 0.5. Lines indicate median values and the circled numbers represent the percentage of infected samples. c Merged z-stack confocal images of midguts infected by 2 × 107 or 2 x 108 PFU/mL of BUN-ΔNSm and 2 x 108 PFU/mL of BUNV-wt and stained with an N antibody (green) and DAPI (blue). Scale bars are 150 µm. Total number of N positive cells per midgut of infected female mosquitoes with 2 x 107 (n = 22) or 2 x 108 PFU/mL (n = 20) of BUN-ΔNSm. Statistical testing by two-tailed Mann-Whitney test. **p = 0.04. Lines indicate mean values. d Mosquitoes were fed with either 2 x 107 or 2 x 108 PFU/mL of BUN-ΔNSm, and individual midguts and rest of bodies virus titres at 3 and 6 dpbm were determined (n = 20 per condition). Statistical testing by a two-way ANOVA followed by a Tukey’s multiple comparisons test. ns, not significant, p value > 0.5; ***p value = 0.0002, ****p < 0.0001. Lines indicate median values and the circle number represent the percentage of infected samples. e Confocal images of midguts infected by 2 x 108 PFU/mL of BUN-ΔNSm and stained at 2, 3 and 6 dpbm with an N antibody (green) and DAPI (blue). Scale bars are 150 µm. Total number of N positive cells per midgut of infected female mosquitoes at 2 (n = 14), 3 (n = 18) and 6 (n = 18) dpbm. Statistical testing by Kruskal-Wallis. ns, not significant, p value > 0.5. Lines indicate mean values. Source data are provided as a Source Data file.
Fig. 7
Fig. 7. NSm is expressed on the cell surface of infected cells and at the periphery of foci in BUNV infected Ae. aegypti midguts.
a Internal and surface expression of NSm and Gc in BUNV-wt infected (MOI 0.01) C6/36 cells permeabilized (for internal staining, top images) or not permeabilized (for surface staining, bottom images). Cells stained with anti-Gc (red), anti-NSm (green), counterstained with DAPI (blue) show partial co-localisation (yellow). Maximum projection of confocal z-series with inserts showing higher magnification images. b Cell surface staining of C6/36 cells infected with recombinant BUNV-NSmV5 virus. Cells were stained with anti-Gc (red), anti-V5 (green), and counterstained with DAPI (blue). Scale bar, 10 µm. cg Midguts dissected from females at 3 dpbm (BUNV-wt titre in the bloodmeal: 7 × 107 PFU/mL) were co-stained with BUNV-specific NSm (green) and Gc (red) antibodies and with DAPI to visualize nuclei (blue). c Maximal intensity z-projection of a whole midgut shows intense NSm immunoreactivity at the periphery of each infection foci. High-magnification image of the boxed area in (c) showing merged z-projections images of (d) NSm and Gc immunoreactive signals and (e) Gc and DAPI signals. Panel (e) contained an additional dashed boxed area to illustrate the Gc staining distributed around the circumference of cells inside the foci of infection. f Individual slice image of the boxed area in (d) shows partial co-localisation between NSm and Gc in infected cells at the periphery of the focus of infection. g Merged z-projection image analysed using Imaris to highlight 3D co-localisation regions between NSm and Gc immunoreactive signals. Both NSm and Gc are co-localised at the junction between infected cells as shown in white by the co-localisation model (yellow arrow). All scale bars are 100 µm.

References

    1. Weaver, S. C. et al. Zika, Chikungunya, and Other Emerging Vector-Borne Viral Diseases. Annu Rev. Med.69, 395–408 (2018). - PMC - PubMed
    1. Wilder-Smith, A. et al. Epidemic arboviral diseases: priorities for research and public health. Lancet Infect. Dis.17, e101–e106 (2017). - PubMed
    1. Weetman, D. et al. Aedes Mosquitoes and Aedes-Borne Arboviruses in Africa: Current and Future Threats. Int. J. Environ. Res. Pub. Health15, 220 (2018). - PMC - PubMed
    1. Tajudeen, Y. A. et al. Emerging Arboviruses of Public Health Concern in Africa: Priorities for Future Research and Control Strategies. Challenges13, 60 (2022).
    1. Mordecai, E. A. et al. Climate change could shift disease burden from malaria to arboviruses in Africa. Lancet Planet. Health4, e416–e423 (2020). - PMC - PubMed

Substances

LinkOut - more resources