. 2025 Jan 31;16(1):1212.
doi: 10.1038/s41467-025-56456-y.

Cellular senescence-associated gene IFI16 promotes HMOX1-dependent evasion of ferroptosis and radioresistance in glioblastoma

Affiliations

Cellular senescence-associated gene IFI16 promotes HMOX1-dependent evasion of ferroptosis and radioresistance in glioblastoma

Yuchuan Zhou et al. Nat Commun. .

Abstract

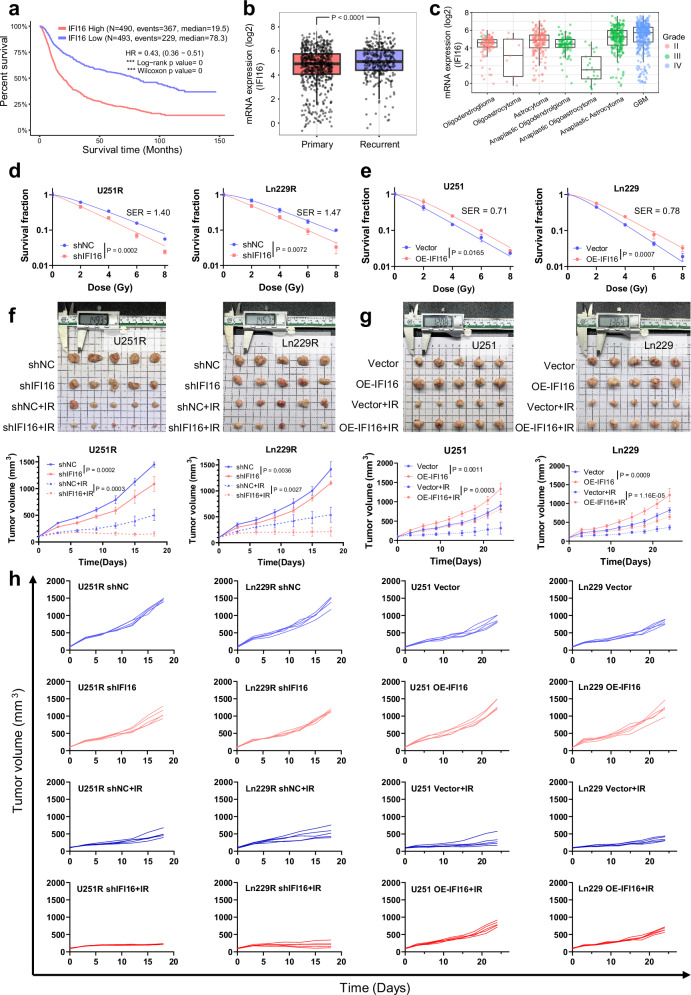
Glioblastoma multiforme (GBM) remains a therapeutic challenge due to its aggressive nature and recurrence. This study establishes a radioresistant GBM cell model through repeated irradiation and observes a cellular senescence-like phenotype in these cells. Comprehensive genomic and transcriptomic analyses identify IFI16 as a central regulator of this phenotype and contributes to radioresistance. IFI16 activates HMOX1 transcription thereby attenuating ferroptosis by reducing lipid peroxidation, ROS production, and intracellular Fe2+ content following irradiation. Furthermore, IFI16 interacts with the transcription factors JUND and SP1 through its pyrin domain, robustly facilitating HMOX1 expression, further inhibiting ferroptosis and enhancing radioresistance in GBM. Notably, glyburide, a sulfonylurea compound, effectively disrupts IFI16 function and enhances ferroptosis and radiosensitivity. By targeting the pyrin domain of IFI16, glyburide emerges as a potential therapeutic agent against GBM radioresistance. These findings underscore the central role of IFI16 in GBM radioresistance and offer promising avenues to improve GBM treatment.


Conflict of interest statement

Competing interests: The authors declare no competing interests.

Figures

Fig. 1
Fig. 1. Radioresistant GBM cells exhibit a cellular senescence-like phenotype.
a The method for generating radioresistant cell lines U251R and Ln229R. b, c Survival fractions of U251R and Ln229R cells and their parent cell lines U251 (b) and Ln229 (c) after irradiation with different doses of X-rays (n = 3). Two-way ANOVA test was applied. Data are presented as mean ± SD. d Western blot assay of HP1, p21, H3K27ac, and p16 proteins in four GBM cells. e The length-width radio of U251R and Ln229R cells and their parent cell lines U251 and Ln229 (n = 3). Scale bars, 25 μm. An unpaired two-tailed t-test was applied. Data are presented as mean ± SD. f The β-galactosidase assay of GBM cells (n = 3). Scale bars, 100 μm. An unpaired two-tailed t-test was applied. Data are presented as mean ± SD. g RT-qPCR analysis of SASP expressions in the GBM cells (n = 3). Data are presented as mean ± SD. h Concentrations of cytokines CCL5, IL-6, MMP-9, and IFN-β in the supernatants of GBM cells (n = 3). An unpaired two-tailed t-test was applied. Data are presented as mean ± SD. i Immunofluorescence analysis of Ki67 expression and Ki67-positive area across GBM cell population (n = 3). Scale bars, 20 μm. An unpaired two-tailed t-test was applied. Data are presented as mean ± SD. j GSEA analysis of the regulation of immune system process pathway in RNA-seq results of U251R/U251 (U251R vs U251). k Top 10 genes of GO functional enrichment analysis of RNA-seq results of U251R/U251. The p-values were calculated using the hypergeometric test by ClusterProfiler. “n” means the number of individual experiments. Source data are provided as a Source Data file.
Fig. 2
Fig. 2. IFI16 is a critical gene in regulating cellular senescence-like phenotype in GBM.
a The GO analysis of the intersection of the different peaks and DEGs between ATAC-seq and RNA-seq of U251R/U251 cells. The p-values were calculated using the hypergeometric test by ClusterProfiler. b The ATAC-seq peaks at IFI16 in U251R/U251. c Western blot assay of IFI16 proteins in GBM cells. d The chord plot of the top five GO terms of the DEGs between U251 and U251R cells. e The GSEA analysis of the regulation of immune system process pathway in RNA-seq results of U251R cells with IFI16 knockdown (shIFI16) and negative control (shNC). f The β-galactosidase assay of U251R and Ln229R cells with shIFI16 (n = 3). An unpaired two-tailed t-test was applied. Data are presented as mean ± SD. g Western blot assay of IFI16, HP1, p21, H3K27ac, and p16 proteins in U251R and Ln229R cells with shIFI16. h Immunofluorescence analysis of Ki67 expression and Ki67-positive area across U251R and Ln229R cells with shIFI16 (n = 3). Scale bars, 20 μm. An unpaired two-tailed t-test was applied. Data are presented as mean ± SD. i RT-qPCR analysis of SASP factors in U251R and Ln229R cells with shIFI16 (n = 3). Data are presented as mean ± SD. j Concentrations of cytokines CCL5, IL-6, MMP-9, and IFN-β in the supernatants of U251R and Ln229R cells with shIFI16 (n = 3). An unpaired two-tailed t-test was applied. Data are presented as mean ± SD. “n” means the number of individual experiments.
Fig. 3
Fig. 3. IFI16 contributes to the radioresistance of GBM.
a Kaplan–Meier curve of GBM survivals based on the expression status of IFI16 according to the GlioVis database. Kaplan–Meier survival analysis was applied. b, c The expression level of IFI16 in the primary and recurrent GBM (b) and in the ascending grades of GBM (c) according to the GlioVis database. The middle line of each box represents the median (50th percentile), with the box edges corresponding to the 1st (Q1) and 3rd (Q3) quartiles, reflecting the interquartile range (IQR). Whiskers indicate the smallest and largest values within 1.5 × IQR from Q1 and Q3, respectively. An unpaired two-tailed t-test was applied. d, e Survival fractions of U251R and Ln229R cells with IFI16 knockdown (d) and U251 and Ln229 cells with IFI16 overexpression (e) after irradiation with different doses of X-rays (n = 3). Two-way ANOVA test was applied. Data are presented as mean ± SD. f, g The images of xenograft tumors in the indicated group after irradiation. Two-way ANOVA test was applied. Data are presented as mean ± SD. h Tumor growth curves for each mouse in the indicated groups (N = 5 per group). Data are presented as mean ± SD. “n” means the number of individual experiments. “N” represents the number of mice analyzed.
Fig. 4
Fig. 4. IFI16 as a key regulator in the suppression of ferroptosis following irradiation.
a Growth inhibition of GBM cells pre-treated with DFO, Fer-1, Z-VAD, Nec-1, and 3-MA at 48 h after 6 Gy irradiation (n = 3). An unpaired two-tailed t-test was applied. Data are presented as mean ± SD. b, c Survival curves of irradiated U251R (b) and Ln229R (c) cells with IFI16 knockdown and Fer-1 treatment before irradiation with different doses of X-rays (n = 3). Two-way ANOVA test was applied. Data are presented as mean ± SD. d Western blot assay of IFI16 and GPX4 proteins in U251R and Ln229R cells with IFI16 knockdown after 6 h of 6 Gy irradiation (n = 3). An unpaired two-tailed t-test was applied. Data are presented as mean ± SD. e Lipid peroxidation detection of C11-BODIPY in U251R and Ln229R cells with IFI16 knockdown after 6 h of 6 Gy irradiation (n = 3). An unpaired two-tailed t-test was applied. Data are presented as mean ± SD. f, g Relative ROS level (f) and relative Fe2+ level (g) of U251R and Ln229R cells with IFI16 knockdown at 1 h (ROS level) or 4 h (Fe2+ level) after 6 Gy irradiation (n = 3). An unpaired two-tailed t-test was applied. Data are presented as mean ± SD. h Western blot assay of IFI16 and GPX4 proteins in U251R and Ln229R cells with IFI16 knockdown and IFI16 overexpression after 6 h of 6 Gy irradiation (n = 3). An unpaired two-tailed t-test was applied. Data are presented as mean ± SD. i Lipid peroxidation detection of C11-BODIPY in U251R and Ln229R cells with IFI16 knockdown and IFI16 overexpression after 6 h of 6 Gy irradiation (n = 3). An unpaired two-tailed t-test was applied. Data are presented as mean ± SD. j, k Relative ROS level (j) and relative Fe2+ level (k) of U251R and Ln229R cells with IFI16 knockdown and IFI16 overexpression at 1 h (ROS level) or 4 h (Fe2+ level) after 6 Gy irradiation (n = 3). An unpaired two-tailed t-test was applied. Data are presented as mean ± SD. “n” means the number of individual experiments.
Fig. 5
Fig. 5. IFI16 regulates GBM ferroptosis in a HMOX1-dependent manner.
a The intersection of the FerrDb database (Suppressor and Driver), RNA-seq of U251 and U251R (U251 vs U251R) and RNA-seq of U251R with IFI16 knockdown and with negative control (shNC vs shIFI16). b Representative immunohistochemistry images and the positive area of p21, IFI16, HMOX1, and GPX4 proteins in the GBM clinical tissues. (N = 18 in primary group and N = 19 in recurrence group). An unpaired two-tailed t-test was applied. Data are presented as mean ± SD. c Spearman and Pearson correlation analysis between IFI16 and HMOX1 in GBM patients according to the GlioVis database. Pearson correlation analysis was applied. d Western blot assay of IFI16, HMOX1, and GPX4 proteins in U251R and Ln229R cells with IFI16 knockdown and HMOX1 overexpression after 6 h of 6 Gy irradiation (n = 3). An unpaired two-tailed t-test was applied. Data are presented as mean ± SD. e Lipid peroxidation detection of C11-BODIPY in U251R and Ln229R cells with IFI16 knockdown and HMOX1 overexpression after 6 h of 6 Gy irradiation (n = 3). An unpaired two-tailed t-test was applied. Data are presented as mean ± SD. f, g Relative ROS level (f) or relative Fe2+ level (g) of U251R and Ln229R cells with IFI16 knockdown and HMOX1 overexpression at 1 h (ROS level) or 4 h (Fe2+ level) after 6 Gy irradiation (n = 3). An unpaired two-tailed t-test was applied. Data are presented as mean ± SD. h, i Survival curves of U251R (h) and Ln229R (i) with IFI16 knockdown and HMOX1 overexpression after irradiation with different doses of X-rays (n = 3). Two-way ANOVA test was applied. Data are presented as mean ± SD. “n” means the number of individual experiments; “N” means the number of subjects.
Fig. 6
Fig. 6. IFI16 promotes HMOX1 transcription by interacting with JUND and SP1.
a The motif analysis of ATAC-seq of U251R/U251 by HOMER. The p-values were calculated using the hypergeometric test. b Schematic representation of the human HMOX1 gene promoter with JUND binding motif (p1 region) and SP1 binding motif (p2 region). c The ATAC-seq peaks at HMOX1 in U251 and U251R cells. d The fold change of the DEGs of RNA-seq and different peaks of ATAC-seq. e, f ChIP-qPCR of JUND, HDAC1, SP1, and H3K27ac at the p1 region (e) and p2 region (f) in four GBM cells (n = 3). An unpaired two-tailed t-test was applied. Data are presented as mean ± SD. g, h ChIP-qPCR of JUND, HDAC1, SP1, and H3K27ac at the p1 region (g) and p2 region (h) in U251R and Ln229R cells with IFI16 knockdown (n = 3). An unpaired two-tailed t-test was applied. Data are presented as mean ± SD. i, j ChIP-qPCR of JUND, HDAC1, SP1, and H3K27ac at the p1 region (i) and p2 region (j) in U251 and Ln229 cells with IFI16 overexpression (n = 3). An unpaired two-tailed t-test was applied. Data are presented as mean ± SD. k Schematic representation of the human HMOX1 gene promoter with the JUND binding motif and SP1 binding motif fused to a pGL3-basic luciferase reporter (upper pane) and luciferase reporter assay of pGL-HMOX1-WT, pGL-HMOX1-ΔJBM, and pGL-HMOX1-ΔSBM reporters cotransfected with JUND, IFI16, and SP1 expression vectors in U251 cells (n = 3) (lower pane). An unpaired two-tailed t-test was applied. Data are presented as mean ± SD. l, m RT-qPCR analysis (l) or Western blot assay (m) of HMOX1 in U251 and Ln229 cells with the overexpression of JUND, SP1, and IFI16 (n = 3). An unpaired two-tailed t-test was applied. Data are presented as mean ± SD. “n” means the number of individual experiments.
Fig. 7
Fig. 7. IFI16 interacts with JUND through its pyrin domain.
a Immunoblots of Co-IP assay that verified the interaction between IFI16 and JUND. b Co-IP assays showing IFI16 and JUND interactions under treatments with EtBr, DNase, and RNase. c Schematic diagram depicting fragmental IFI16 proteins (upper pane) and Co-IP assay that validated the binding of JUND to IFI16 fragments (lower pane). d Schematic diagram depicting fragmental JUND proteins (upper pane) and Co-IP assay that validated the binding of IFI16 to JUND fragments (lower pane). MBM Menin-binding motif, MAP MAP kinase docking motif, PTM post-translational modifications regions. e Surface diagram of the docking model and their interface residues between IFI16 and JUND protein (IFI16, blue; JUND, yellow; hydrogen bond interaction, green dotted line). f Amino acid sequences of pyrin regions of IFI16, IFI4, ASC, NLRP3, and MEFV proteins from different species (A0A3Q1M2Q8, the name of MEFV in Bovine on UniProt. IF16, the name of IFI16 in Homo sapiens on UniProt). g Schematic representation of two flag-fused IFI16 plasmids with wild-type (WT) or K26L29 → A26A29 (KL → AA) mutants. h Co-IP assay of IFI16WT, IFI16KL→AA, JUND, and SP1 in U251 and Ln229 cells.
Fig. 8
Fig. 8. Glyburide sensitizes GBM cells to radiotherapy.
a Surface diagram of the docking model between IFI16 and glyburide and the interface residues in IFI16 protein and glyburide (IFI16, blue; glyburide, green; hydrogen bond interaction, red dotted line). b Immunoblots of DARTS assay that verified the binding of glyburide to IFI16 in U251 cells (n = 3). An unpaired two-tailed t-test was applied. Data are presented as mean ± SD. c Schematic of experimental design for orthotopic xenograft model. d Kaplan–Meier survival curves of U251R xenograft-bearing mice from the day of tumor cells implantation to mice death or maximum study duration of 60 days (N = 5 per group). Kaplan–Meier survival analysis was applied. Data are presented as mean ± SD. e Time response of the mice weight after implantation of U251R cells, on average, the xenograft was locally irradiated with 15 Gy of X-rays, and the mice were administered intragastrically with 1 mg/kg glyburide 2 h before irradiation (N = 5 per group). Data are presented as mean ± SD. f Time response of the mice weight after implantation of U251R cells on individual mice (N = 5 per group). g Representative MRI images of U251R xenografts by T2-weighted MRI at 10-day and 20-day after cell implantation, the whole mount HE-stained brain sections of mice, and the representative immunohistochemistry images of IFI16, HMOX1, and GPX4 in the tumor tissues. Mice were treated with saline + sham-irradiation (Ctrl), glyburide + sham-irradiation (Gly), saline + irradiation (Ctrl + IR), or the combination of glyburide and irradiation (Gly + IR). HE hematoxylin-eosin. h Tumor volumes of U251R xenografts measured by MRI scan (N = 5 per group). An unpaired two-tailed t-test was applied. Data are presented as mean ± SD. i The positive area of IFI16, HMOX1, and GPX4 in the U251R tumor tissues (N = 5 per group). An unpaired two-tailed t-test was applied. Data are presented as mean ± SD. “n” means the number of individual experiments. “N” represents the number of mice analyzed.
Fig. 9
Fig. 9. The mechanistic diagram of IFI16 driving HMOX1-dependent ferroptosis inhibition and radioresistance in GBM.
In radiosensitive glioma cells, a low level of IFI16 expression heightens the binding affinity of SP1/HDAC1 transcriptional repressor complex to HMOX1 promoter regions, impeding JUND from activating HMOX1 transcription. The reduction in HMOX1 expression amplifies lipid peroxidation, triggers ferroptosis, and enhances radiosensitivity. Conversely, IFI16 induces radioresistance in senescent GBM cells by promoting JUND transcriptional activity and facilitating HMOX1 transcription. Consequently, the increased HMOX1 expression mitigates lipid peroxidation, suppresses ferroptosis, and fortifies the development of radioresistance. Moreover, glyburide antagonizes the function of IFI16, thereby promoting the radiosensitivity of GBM. Gly glyburide. The schematic was Created in BioRender. Zhou, Y. (2024) https://BioRender.com/v43b601.

References

    1. Ostrom, Q. T. et al. CBTRUS statistical report: primary brain and other central nervous system tumors diagnosed in the United States in 2015-2019. Neuro Oncol.24, v1–v95 (2022). - PMC - PubMed
    1. Jiang, T. et al. Clinical practice guidelines for the management of adult diffuse gliomas. Cancer Lett.499, 60–72 (2021). - PubMed
    1. Bikfalvi, A. et al. Challenges in glioblastoma research: focus on the tumor microenvironment. Trends Cancer9, 9–27 (2023). - PubMed
    1. Zhao, J. et al. Immune and genomic correlates of response to anti-PD-1 immunotherapy in glioblastoma. Nat. Med.25, 462–469 (2019). - PMC - PubMed
    1. Wu, L. et al. Natural coevolution of tumor and immunoenvironment in glioblastoma. Cancer Discov.12, 2820–2837 (2022). - PMC - PubMed

MeSH terms

LinkOut - more resources