. 2025 Jan 31;12(1):187.
doi: 10.1038/s41597-025-04504-z.

A MALDI-ToF mass spectrometry database for identification and classification of highly pathogenic bacteria

Affiliations

A MALDI-ToF mass spectrometry database for identification and classification of highly pathogenic bacteria

Peter Lasch et al. Sci Data. .

Abstract

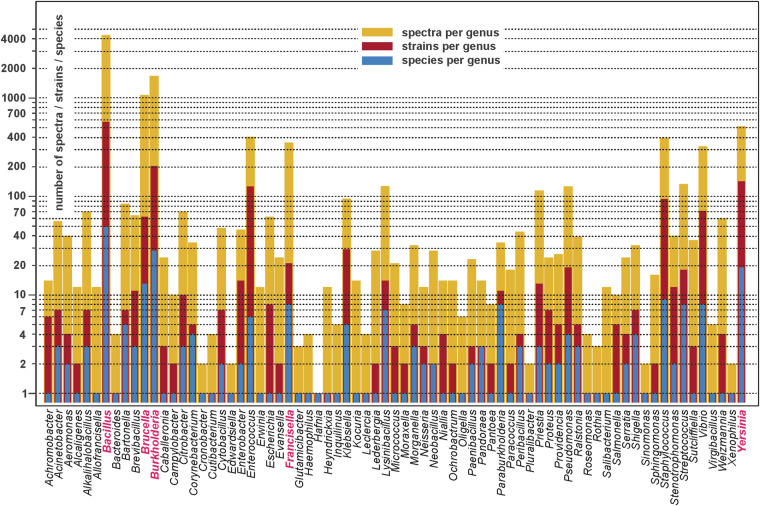
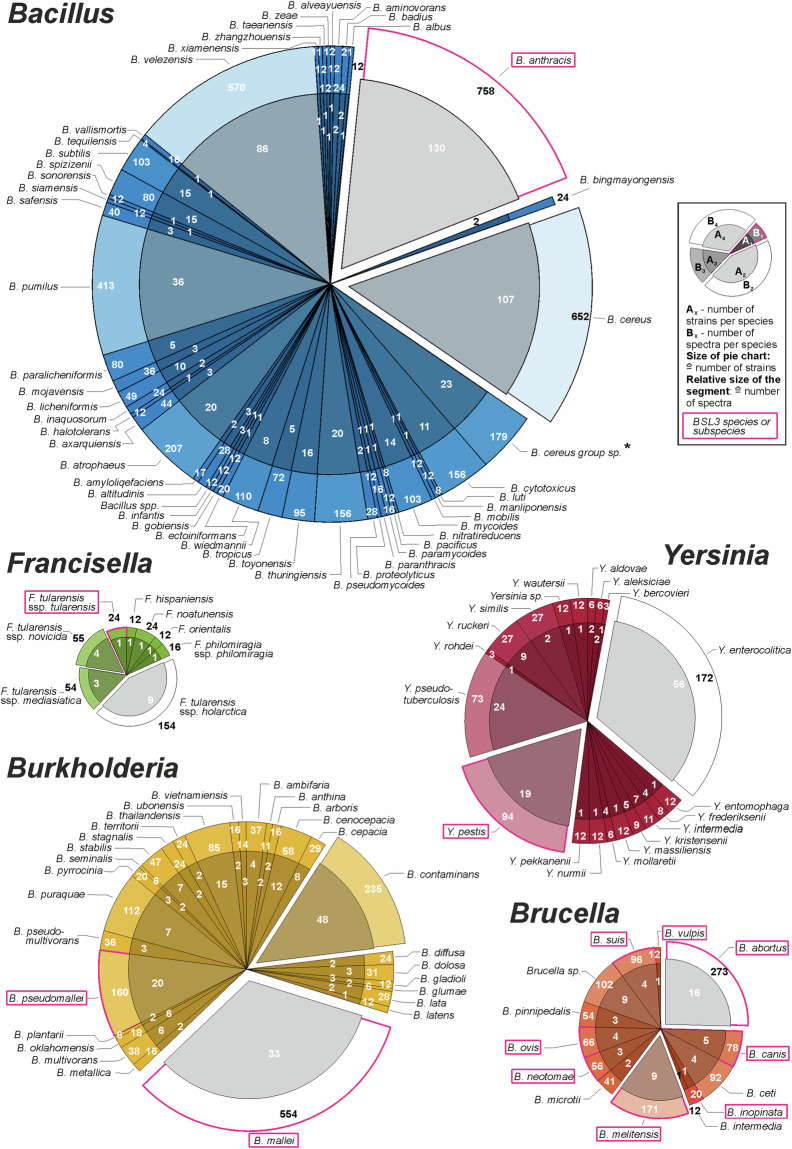
Today, MALDI-ToF MS is an established technique to characterize and identify pathogenic bacteria. The technique is increasingly applied by clinical microbiological laboratories that use commercially available complete solutions, including spectra databases covering clinically relevant bacteria. Such databases are validated for clinical, or research applications, but are often less comprehensive concerning highly pathogenic bacteria (HPB). To improve MALDI-ToF MS diagnostics of HPB we initiated a program to develop protocols for reliable and MALDI-compatible microbial inactivation and to acquire mass spectra thereof many years ago. As a result of this project, databases covering HPB, closely related bacteria, and bacteria of clinical relevance have been made publicly available on platforms such as ZENODO. This publication in detail describes the most recent version of this database. The dataset contains a total of 11,055 spectra from altogether 1,601 microbial strains and 264 species and is primarily intended to improve the diagnosis of HPB. We hope that our MALDI-ToF MS data may also be a valuable resource for developing machine learning-based bacterial identification and classification methods.


Conflict of interest statement

Competing interests: The authors declare no competing interests.

Figures

Fig. 1
Fig. 1
General workflow of MALDI-ToF mass spectrometry-based identification analysis.
Fig. 2
Fig. 2
Bar chart giving an overview on the microbial genera represented in the ZENODO MALDI-ToF mass spectrometry database. The height of the bars illustrates the number of MALDI-ToF mass spectra per genus (dark yellow bars), the number of strains of the given genus (ruby red bars) as well as the number of microbial species per genus (blue bars). Note the logarithmic scaling of the y-axis. Further details on database composition are available from the ZENODO data repository, see MS Excel file “Taxonomy information - RKI MALDI-ToF MS database of HPB at ZENODO v.4.xlsx”.
Fig. 3
Fig. 3
Pie charts illustrating database content by strains and species of selected genera containing highly pathogenic bacterial species: Bacillus, Brucella, Burkholderia, Francisella, and Yersinia. The size (area) of each pie chart is proportional to the number of strains of the given genus represented in the data base. Furthermore, each pie chart contains segments that provide further information. The size and color intensity of the individual segments are proportional, or inversely proportional, respectively, to the number of spectra recorded from the given species. The chart segments further contain information regarding the number of strains per species (numbers in the inner circles) and the number of spectra per species (outer circle). Names of highly pathogenic (BSL-3) microbial species or subspecies are plotted in pink framed text boxes. Bacillus cereus group sp.*: Members of the B. cereus group for which no species assignment is available.
Fig. 4
Fig. 4
Comparison of high and moderate quality MALDI-ToF mass spectra. (a) High quality original spectrum obtained from strain Bacillus pumilus LNXM70. This spectrum shows relatively little noise, a flat baseline curve and many peaks with high resolving power. The overall quality test (QT) score reached a value of 82.2 (cf. inset for more details). The QT score may vary between values of 0 (poor quality) and 100 (excellent quality) (b) unprocessed MALDI-ToF mass spectrum acquired from a Brevibacillus porteri HB1.2 preparation showing an enhanced noise level, an elevated baseline in the low m/z region and less peaks of lower resolution. In this example, a QT score of 33.3 was determined. (c) processed spectrum derived from the original spectrum of panel a by smoothing, baseline correction and intensity normalization. (d) Preprocessed spectrum of panel b. As shown by this example, data preprocessing improves the apparent spectrum quality and is therefore important for a more accurate peak detection. This ultimately increases the taxonomic resolution and, as a result, the overall accuracy of the microbiological diagnostic method.
Fig. 5
Fig. 5
Results of quality tests (QT) of microbial MALDI-ToF mass spectra. Altogether, 11,055 mass spectra of the ZENODO v.4.2 MALDI-ToF MS database were tested and the respective QT parameters were obtained and analyzed. (a) Histogram showing the distribution of noise quality tests. Noise parameter was calculated by first ranking all data points of a spectrum by their intensity values in descending order. Subsequently, noise was calculated as the standard deviation from the lower 60% of all data points. Baseline correction and intensity normalization was carried out beforehand. (b) Histogram showing the frequency distribution of the baseline criterion. (c) Distribution of the QT criterion number of peaks (see text for details). (d) Parameter distribution of the resolving power tests. (e) Histogram of the overall QT results which are derived from the four QT parameters (i) noise, (ii) baseline parameter, (III) the number of peaks, and (iv) resolving power. For more information on QT scores computations, please refer to the MicrobeMS wiki page.
Fig. 6
Fig. 6
Quality of external calibration, exemplary illustrated by data from 2442 MALDI-ToF mass spectra of Bacillus cereus group strains. (a) Pseudo gel view between m/z 4500–8000 obtained from pre-processed (smoothed, baseline subtracted and intensity normalized) mass spectra. B. cereus group-specific MALDI signals are seen at m/z positions 5171 (50S ribosomal protein L34, blue), 5887 (50S ribosomal protein L33 2, peach) and 7367 (Cold shock protein CspB, avocado). (b) Histogram illustrating the distribution of precisely determined experimental positions of the peak assigned to L34, theoretical mass [M + H]+ theo: 5171.10. The histogram inset shows the percentage of B. cereus group spectra of which the peak could be determined, the difference Δ (in ppm units) between the theoretical m/z position and the mean experimental m/z value and the standard deviation δ of the experimental peak positions (also in ppm units). (c) Histogram demonstrating the distribution of the peak positions around 5887 (L33 2, [M + H]+theo: 5886.79). (d) Distribution of peak positions at 7367, [M + H]+theo: 7367.03.

References

    1. Cuenod, A. et al. Quality of MALDI-TOF mass spectra in routine diagnostics: results from an international external quality assessment including 36 laboratories from 12 countries using 47 challenging bacterial strains. Clin. Microbiol. Infect. 10.1016/j.cmi.2022.05.017 (2022). - PubMed
    1. Welker, M., Van Belkum, A., Girard, V., Charrier, J. P. & Pincus, D. An update on the routine application of MALDI-TOF MS in clinical microbiology. Expert Rev Proteomics16, 695–710, 10.1080/14789450.2019.1645603 (2019). - PubMed
    1. Sauer, S. & Kliem, M. Mass spectrometry tools for the classification and identification of bacteria. Nat. Rev. Microbiol.8, 74–82, 10.1038/nrmicro2243 (2010). - PubMed
    1. Maier, T., Klepel, S., Renner, Z. & Kostrzewa, M. Fast and reliable MALDI-TOF MS-based microorganism identification. Nat. Methods.3, 324–334, 10.1038/nmeth870 (2006).
    1. Seng, P. et al. Ongoing revolution in bacteriology: routine identification of bacteria by matrix-assisted laser desorption ionization time-of-flight mass spectrometry. Clin. Infect. Dis.49, 543–551, 10.1086/600885 (2009). - PubMed

MeSH terms

LinkOut - more resources