. 2025 Mar;31(3):996-1007.
doi: 10.1038/s41591-024-03479-5. Epub 2025 Jan 31.

Familial confounding in the associations between maternal health and autism

Affiliations

Familial confounding in the associations between maternal health and autism

Vahe Khachadourian et al. Nat Med. 2025 Mar.

Abstract

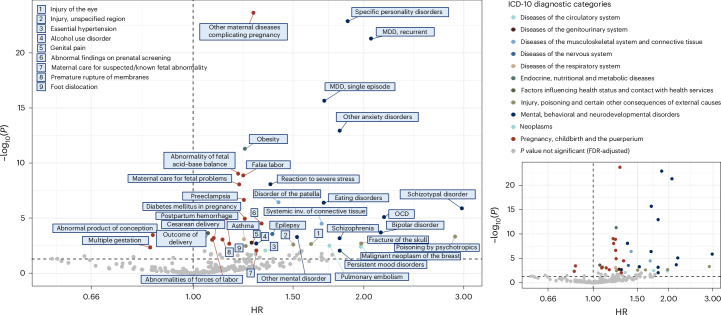
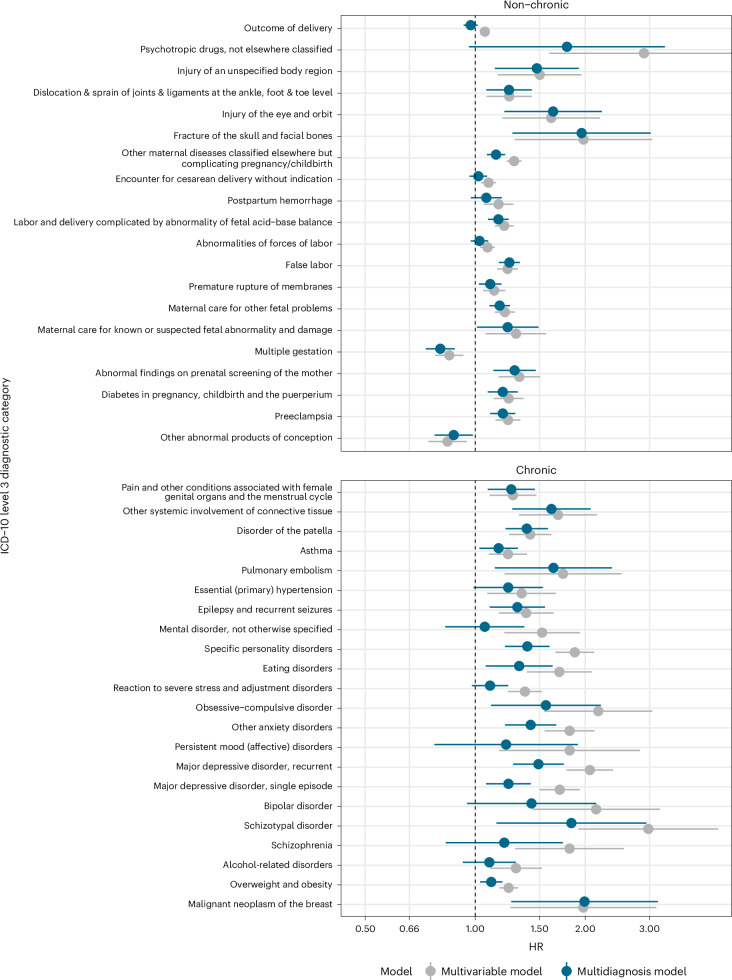
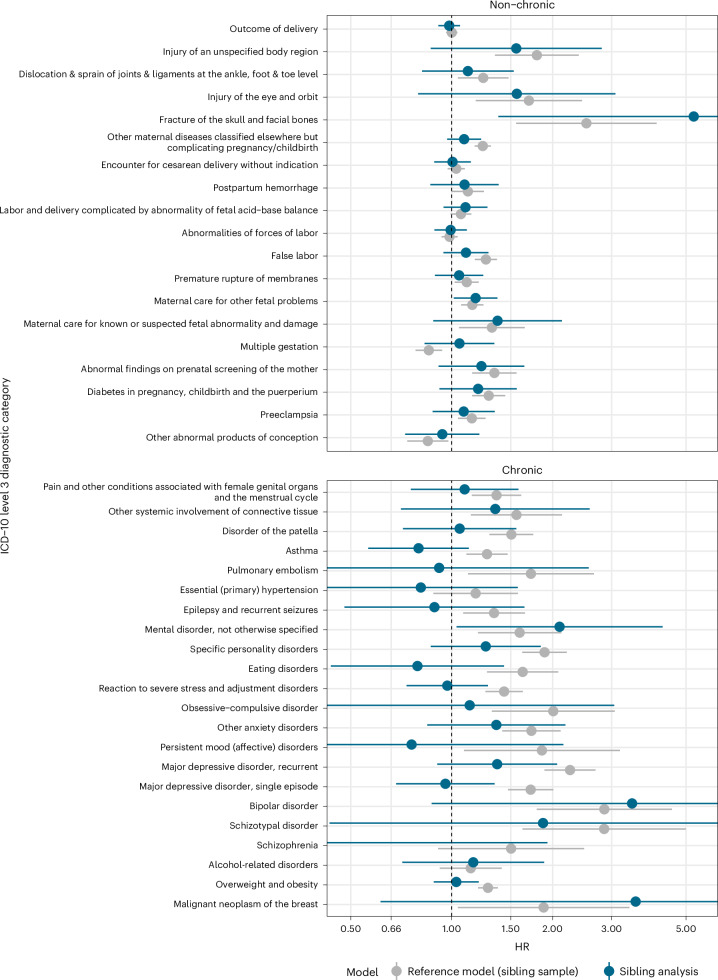
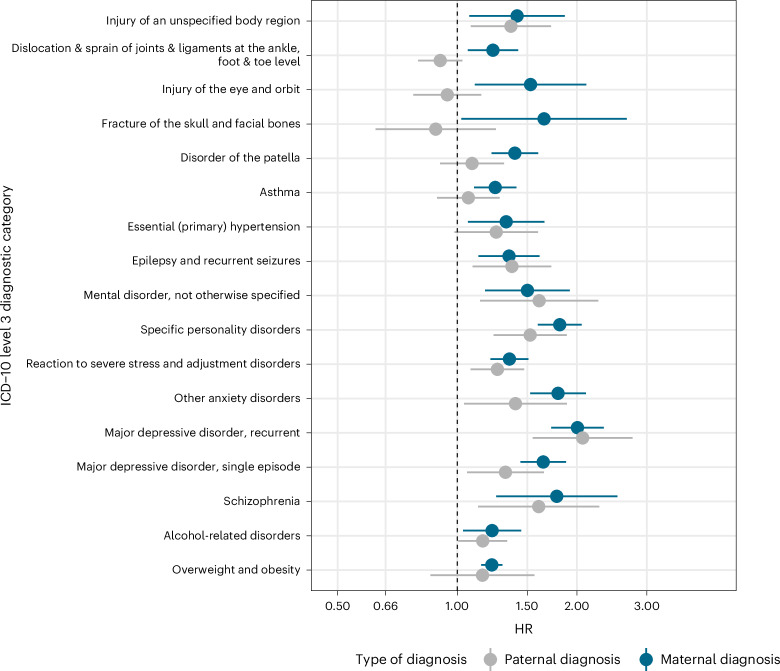
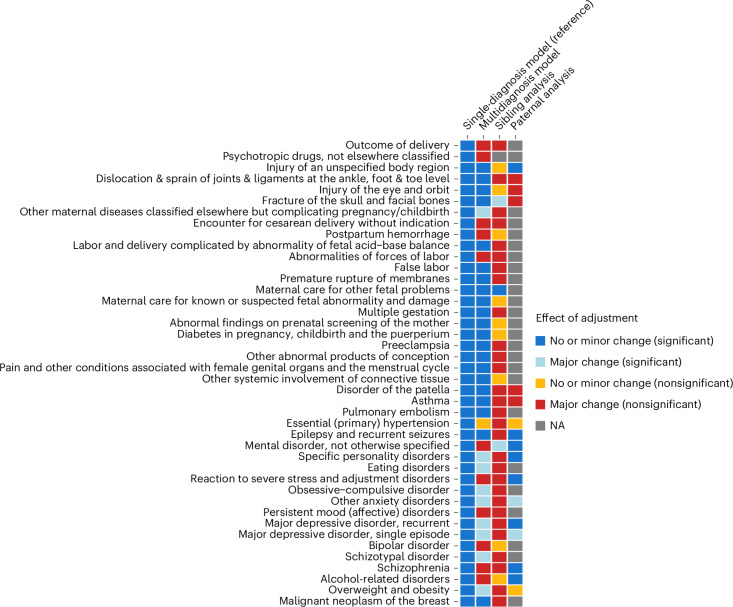
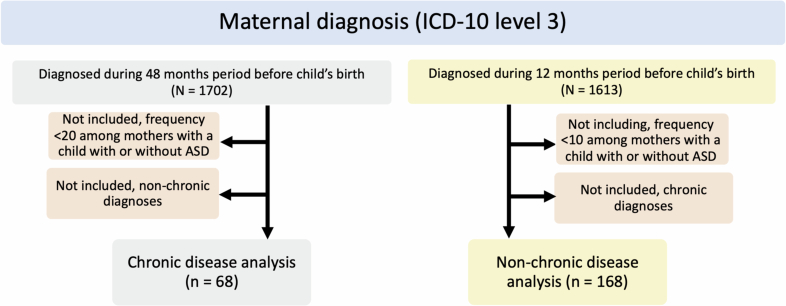
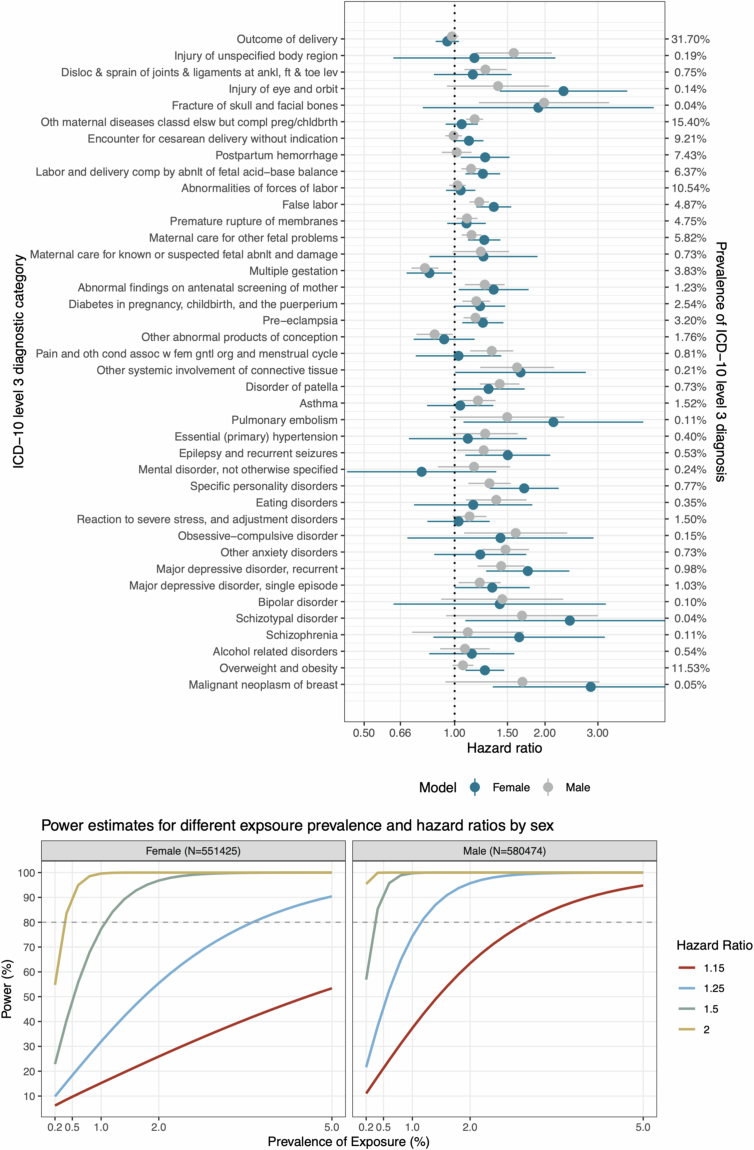
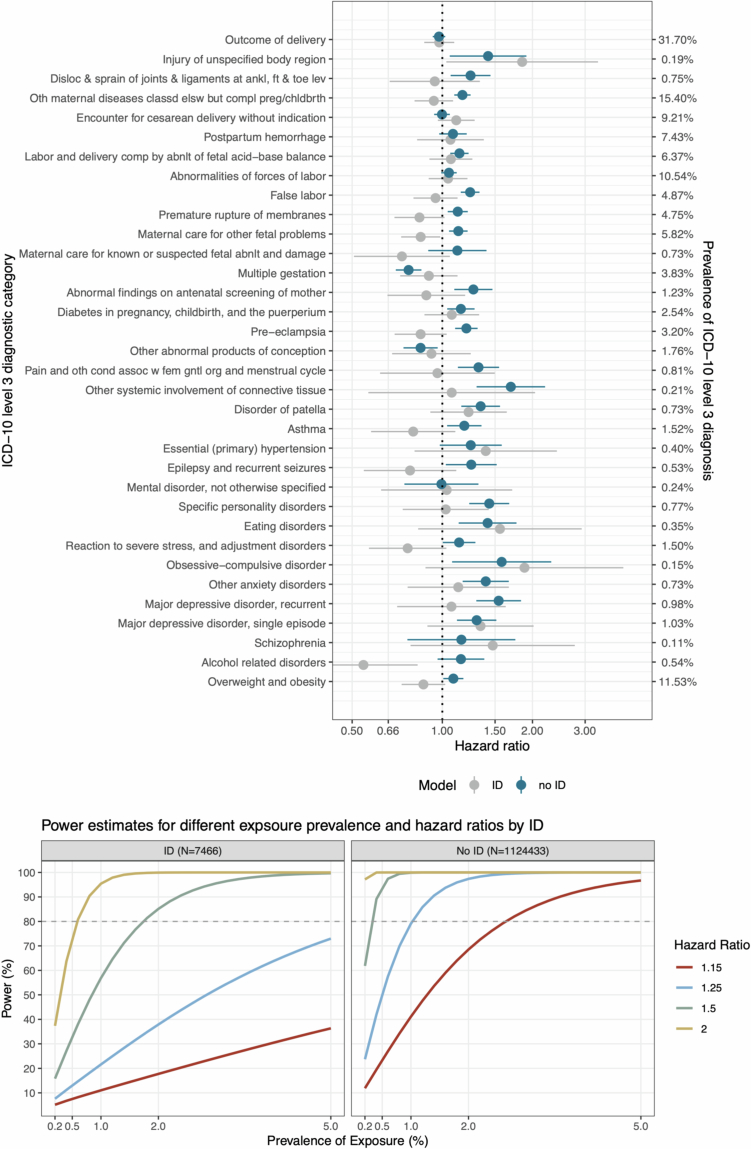
Evidence suggests that maternal health in pregnancy is associated with autism in the offspring. However, most diagnoses in pregnant women have not been examined, and the role of familial confounding remains unknown. Our cohort included all children born in Denmark between 1998 and 2015 (n = 1,131,899) and their parents. We fitted Cox proportional hazard regression models to estimate the likelihood of autism associated with each maternal prenatal ICD-10 diagnosis, accounting for disease chronicity and comorbidity, familial correlations and sociodemographic factors. We examined the evidence for familial confounding using discordant sibling and paternal negative control designs. Among the 1,131,899 individuals in our sample, 18,374 (1.6%) were diagnosed with autism by the end of follow-up. Across 236 maternal diagnoses we tested (prevalence ≥0.1%), 30 were significantly associated with autism after accounting for sociodemographic factors, disorder chronicity and comorbidity, and correction for multiple testing. This included obstetric, cardiometabolic and psychiatric disorders (for example, diabetes in pregnancy (hazard ratio (HR) 1.19, 95% confidence interval (CI) 1.08-1.31) and depression (HR 1.49, 95% CI 1.27-1.75)), previously shown to be associated with autism. Family-based analyses provided strong evidence for familial confounding in most of the observed associations. Our findings indicate pervasive associations between maternal health in pregnancy and offspring autism and underscore that these associations are largely attributable to familial confounding.


Conflict of interest statement

Competing interests: V.K. is currently employed by Takeda Pharmaceutical Company outside of the submitted work. The other authors declare no competing interests.

Figures

Fig. 1
Fig. 1. Associations between ICD-10 level 3 maternal diagnoses and offspring autism in fully adjusted single-diagnosis models.
Point estimates of each association derived from the two-sided Cox proportional hazard model for each diagnosis are illustrated on the x axis, with their P value (−log10(P)) on the y axis. Dots representing each statistically significant association are colored according to the ICD-10 category of the respective diagnosis; nonsignificant associations after correction for multiple testing are shown in gray. The horizontal dashed line represents the P-value cutoff for nominal significance (P = 0.05). The nonannotated plot on the right presents the same data for a clearer visualization of the coefficient distribution. MDD, major depressive disorder; inv., involvement; OCD, obsessive–compulsive disorder.
Fig. 2
Fig. 2. Associations between ICD-10 level 3 maternal diagnoses and offspring autism in fully adjusted single-diagnosis models and the multidiagnosis model.
Point estimates are HRs adjusted for maternal age at childbirth, child’s sex and year of birth, maternal income and education, and maternal healthcare utilization in the 12 months preceding childbirth. Estimates from the multidiagnosis model, in addition to the covariates above, are concurrently adjusted for all significant diagnoses (nonchronic and chronic) in fully adjusted single-diagnosis models (presented in this figure). The error bars represent 95% CIs calculated using point estimates and robust standard errors from the respective regression model.
Fig. 3
Fig. 3. Associations between ICD-10 level 3 maternal diagnoses and offspring autism from reference models (single-diagnosis models in the sibling sample) and sibling analysis (stratified by family identification number).
Point estimates for each diagnosis are HRs from a model adjusted for maternal age at childbirth, child’s sex and year of birth, maternal income and education, and maternal healthcare utilization in the 12 months preceding childbirth. All analyses presented in this figure were restricted to individuals with at least one sibling in the sample (851,570 of the 1,131,899 mother–child dyads in the full birth cohort). The potential differences between the results from the single-diagnosis analysis in the subsample of siblings only and the full sample are likely attributable to the potential differences in sample composition and sample size. Due to the extremely low number of sibling pairs discordant for maternal schizophrenia status and autism (19 pairs), the point estimate from the sibling analysis is out of bounds (HR 0.34, 95% CI 0.06–1.93). The error bars represent 95% CIs calculated using point estimates and robust standard errors from the respective regression model.
Fig. 4
Fig. 4. Associations between ICD-10 level 3 paternal and maternal diagnoses and offspring autism from single-diagnosis analyses.
Point estimates for each diagnosis are HRs from a model adjusted for maternal and paternal ages at childbirth, child’s sex and year of birth, maternal and paternal income and education, and maternal and paternal healthcare utilization in the 12 months preceding childbirth, as well as the same diagnosis in the other parent. The error bars represent 95% CIs calculated using point estimates and robust standard errors from the respective regression model.
Fig. 5
Fig. 5. Overview of the study results.
Tile colors capture the statistical significance of the association between the given maternal diagnosis and offspring autism and the change in the point estimate relative to the reference model (‘minor’ change refers to an HR change of ≤40%, and ‘major’ change refers to an HR change of >40%; the numerical parameters underlying this categorization are presented in Supplementary Tables 2–4, 11 and 12). Associations not estimated due to insufficient frequency of the diagnosis in the analytical subsample, or other methodological considerations, are presented as ‘NA’. The interpretation of the tile color changes by analysis type or column. In the multidiagnosis model, red and light blue tiles indicate diagnoses whose association with autism was reduced after concurrent adjustment for comorbid conditions, suggesting diagnoses whose original association with autism is most likely to have arisen due to comorbidity with other diagnoses. In sibling analysis, red tiles indicate diagnoses whose point estimate shows a relative change of >40% when compared to the point estimate from the reference model, suggesting familial confounding (that is, (HRsib − 1)/(HRref − 1) < 0.6 or (HRsib − 1)/(HRref − 1) > 1.4); yellow tiles indicate diagnoses that may be associated with autism within families, but our analyses were underpowered to detect such effects (the loss of significance was due to widening of the CIs, with little change in the point estimate; for example, injuries of the eye and an unspecified body region, diabetes in pregnancy). In paternal analysis, red tiles indicate diagnoses associated with autism in the mother, but not in the father, suggesting a lack of evidence for familial confounding (consistent with either direct effects of those conditions on the fetus or indirect genetic effects; for example, injury codes, disorders of the patella and asthma); dark and light blue tiles suggest evidence for familial confounding (without and with evidence for additional contributions of a maternal effect, respectively; for example, direct effects on the fetus and/or indirect genetic effects). Reference models for sibling analysis and the paternal model are provided in Supplementary Tables 11 (model 5) and 12 (model 5), respectively.
Extended Data Fig. 1
Extended Data Fig. 1. Flowchart of inclusion of maternal diagnosis around pregnancy in analyses.
Flowchart of the number of maternal diagnoses included in the study.
Extended Data Fig. 2
Extended Data Fig. 2. Associations between ICD-10 level 3 maternal diagnoses and offspring autism for non-chronic and chronic diagnoses stratified by sex of the child.
Point estimates are hazard ratios (HRs) adjusted for maternal age at birth, child’s year of birth, maternal income and education, and maternal health care encounter in the 12-month period preceding childbirth, and concurrently included all the diagnoses (non-chronic and chronic) in this figure. The error bars represent 95% confidence intervals, calculated using point estimates and robust standard errors from respective regression model. Prevalence of ICD-10 diagnoses were estimated using the entire sample, without stratification by child sex.
Extended Data Fig. 3
Extended Data Fig. 3. Associations between ICD-10 level 3 maternal diagnoses and offspring autism for non-chronic and chronic diagnoses stratified by intellectual disability (ID) in the child.
Point estimates are hazard ratios adjusted for maternal age at birth, child’s sex and year of birth, maternal income and education, and maternal health care encounter in the 12-month period preceding childbirth, and concurrently included all the diagnoses (non-chronic and chronic) in this figure. The error bars represent 95% confidence intervals, calculated using point estimates and robust standard errors from respective regression model. Prevalence of ICD-10 diagnoses were estimated using the entire sample, without stratification by child sex.

References

    1. Kodesh, A. et al. Maternal health around pregnancy and autism risk: a population-based study. Psychol. Med.52, 4076–4084 (2022). - PMC - PubMed
    1. Viktorin, A., Uher, R., Reichenberg, A., Levine, S. Z. & Sandin, S. Autism risk following antidepressant medication during pregnancy. Psychol. Med.47, 2787–2796 (2017). - PMC - PubMed
    1. Xiang, A. H. et al. Association of maternal diabetes with autism in offspring. JAMA313, 1425–1434 (2015). - PubMed
    1. Croen, L. A., Grether, J. K., Yoshida, C. K., Odouli, R. & Van de Water, J. Maternal autoimmune diseases, asthma and allergies, and childhood autism spectrum disorders: a case–control study. Arch. Pediatr. Adolesc. Med.159, 151–157 (2005). - PubMed
    1. Atladóttir, H. O. et al. Maternal infection requiring hospitalization during pregnancy and autism spectrum disorders. J. Autism Dev. Disord.40, 1423–1430 (2010). - PubMed

LinkOut - more resources