. 2025 Feb;10(2):569-584.
doi: 10.1038/s41564-024-01905-5. Epub 2025 Jan 31.

Genome-wide gene expression profiles throughout human malaria parasite liver stage development in humanized mice

Affiliations

Genome-wide gene expression profiles throughout human malaria parasite liver stage development in humanized mice

Gigliola Zanghí et al. Nat Microbiol. 2025 Feb.

Abstract

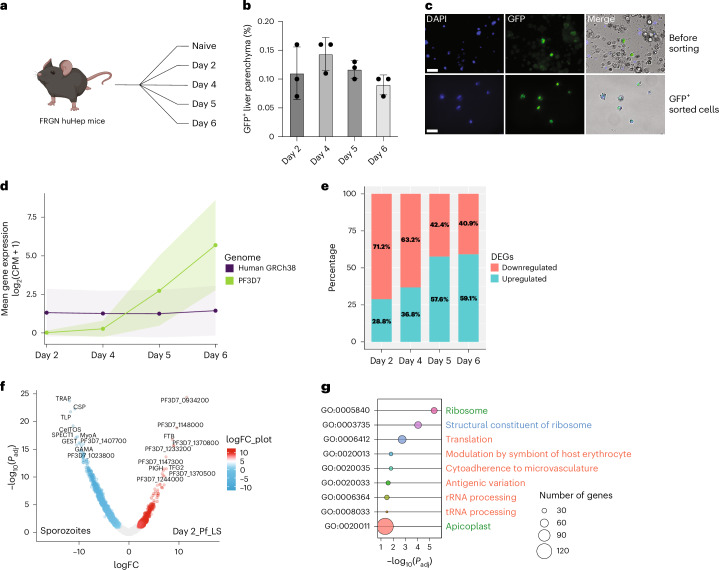
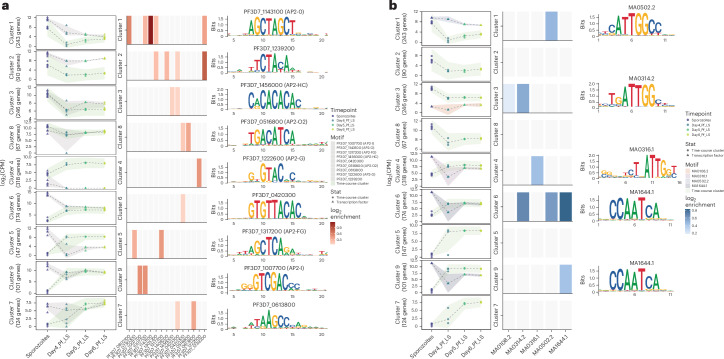
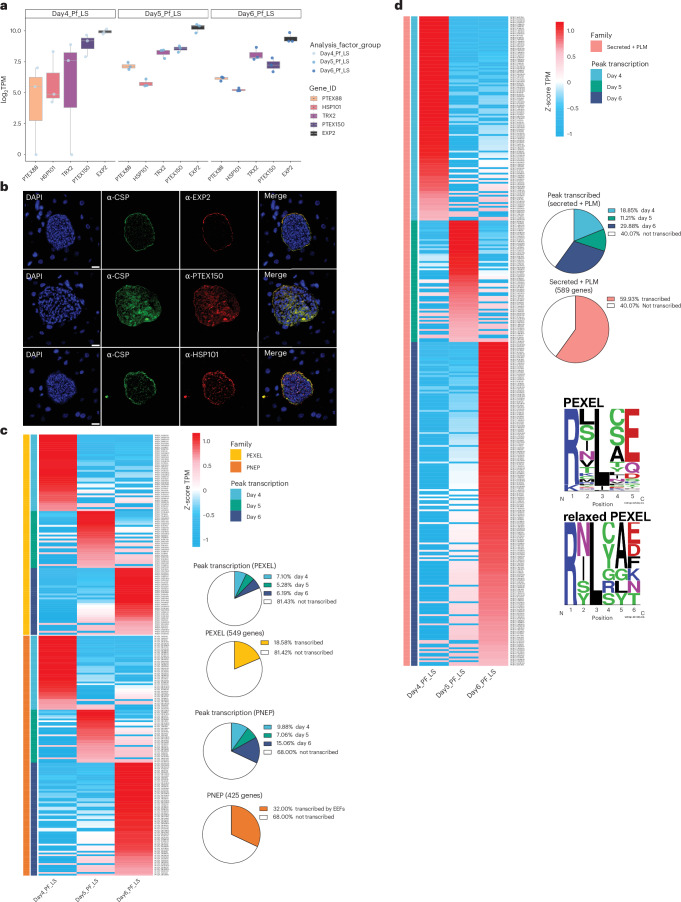
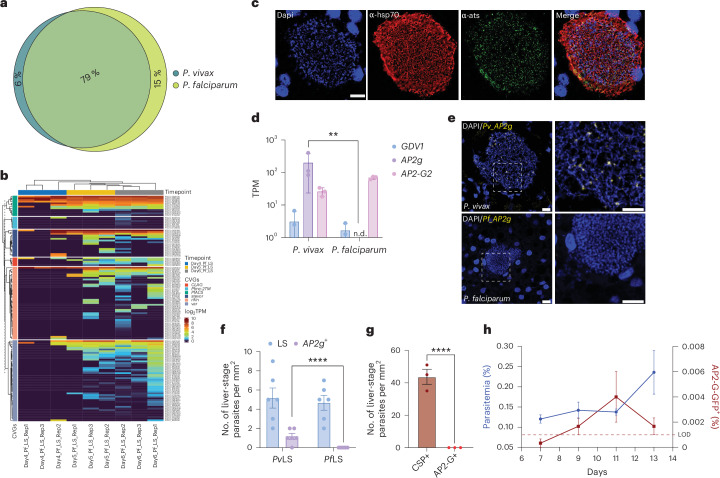
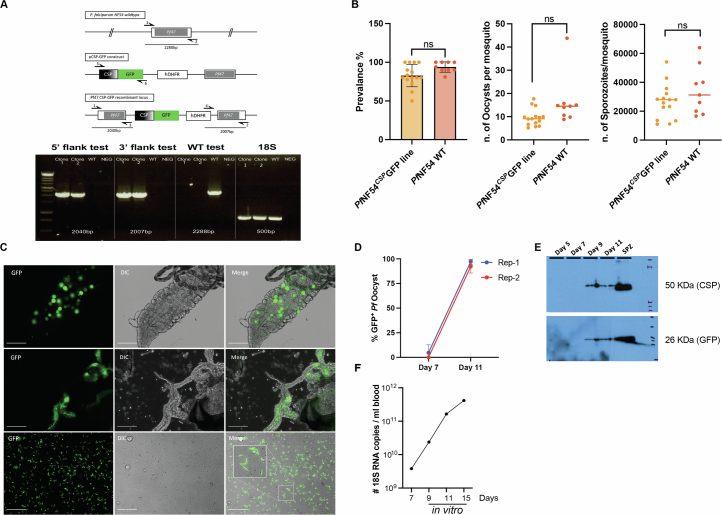
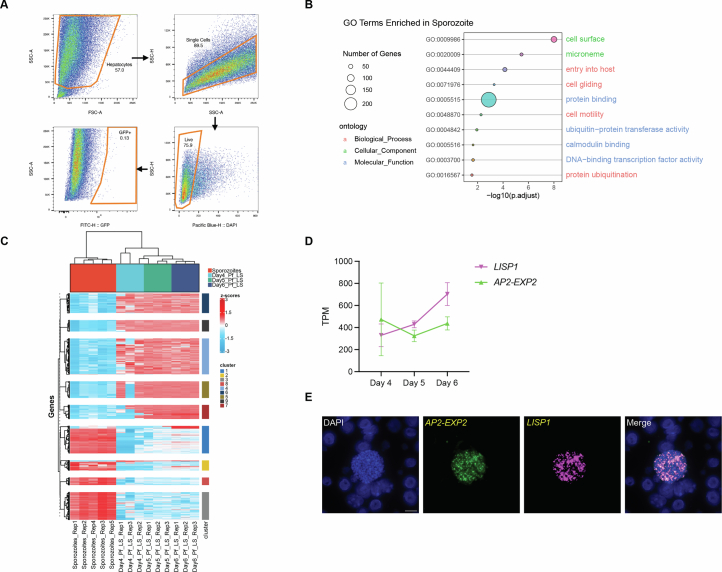
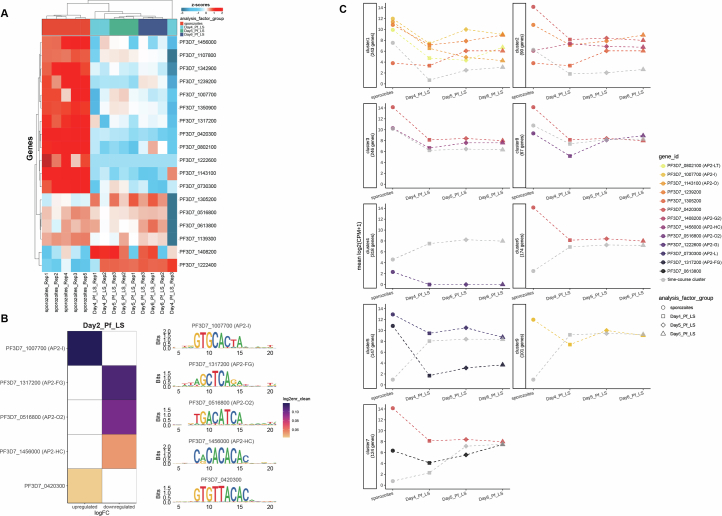
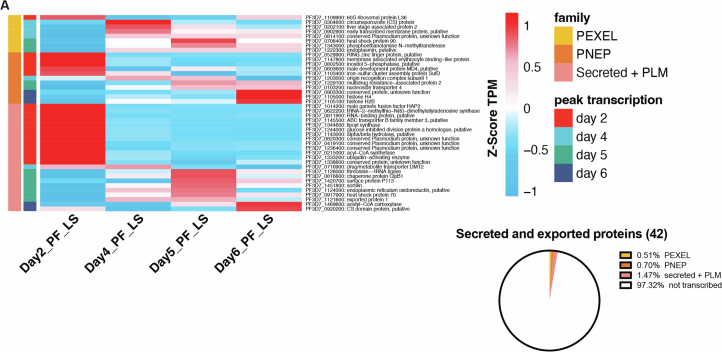
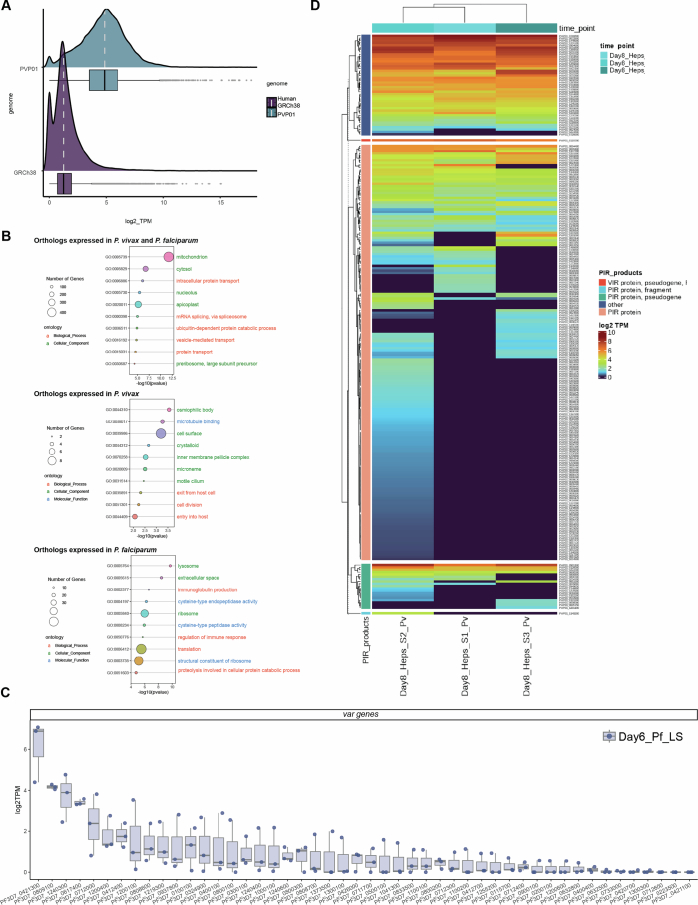
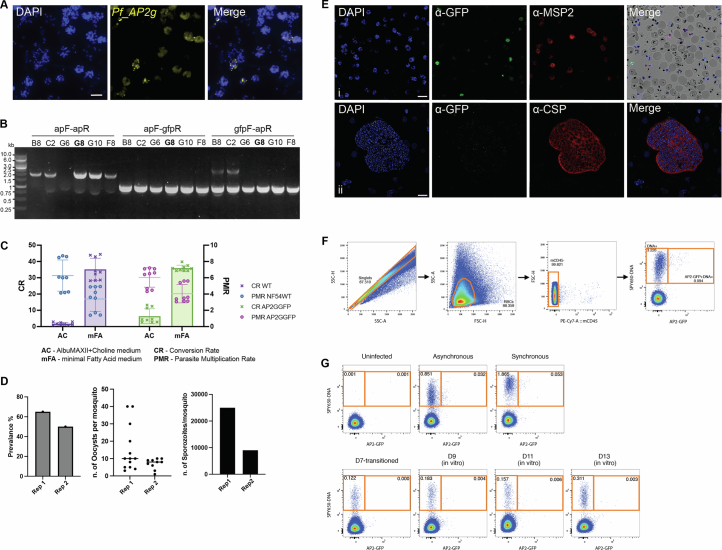
Gene expression of Plasmodium falciparum (Pf) liver-stage (LS) parasites has remained poorly characterized, although they are major vaccine and drug targets. Using a human liver-chimaeric mouse model and a fluorescent parasite line (PfNF54CSPGFP), we isolated PfLS and performed transcriptomics on key LS developmental phases. We linked clustered gene expression to ApiAP2, a major family of transcription factors that regulate the parasite life cycle. This provided insights into transcriptional regulation of LS infection and expression of essential LS metabolic and biosynthetic pathways. We observed expression of antigenically variant PfEMP1 proteins and the major Pf protein export machine PTEX and identified protein candidates that might be exported by LS parasites. Comparing Pf and P. vivax LS transcriptomes, we uncovered differences in their expression of sexual commitment factors. This data will aid LS research and vaccine and drug target identification for prevention of malaria infection.


Conflict of interest statement

Competing interests: E.L.F., V.C. and M.E.F. are employees of Novartis Pharma AG. The remaining authors declare no competing interests.

Figures

Fig. 1
Fig. 1. PfNF54CSPGFP parasites enable the isolation of PfLS-infected human hepatocytes from FRG huHep mice and transcriptome analysis.
a, Experimental design. FACS isolation of GFP+ Pf-infected human hepatocytes (PfGFP+) from FRG huHep mice on days 2, 4, 5 and 6 PI. Created with BioRender.com. b, Histogram showing percentage of PfGFP+ hepatocytes as compared to the total at each timepoint (n = 3) (refer to Extended Data Fig. 2a). Data are presented as mean ± s.d. c, Live imaging of PfGFP+ hepatocytes (green) before and after sorting. DNA stained with Hoechst dye (blue). Merge with DIC image. Scale bar, 50 μm. d, Ribbon graph showing the mean gene expression of H. sapiens (purple) and P. falciparum (green) transcriptomes over time. Ribbons represent the mean ± s.d. e, Stacked bar plot showing the number of DEGs for each PfLS developmental timepoint compared to sporozoites. f, Volcano plot showing DEGs between sporozoites and PfLS parasites at day 2 PI. g, Bubble plot with GO terms enriched (Padj < 0.05) in the upregulated genes at day 2 PI. Bubbles represent unique GO terms (y-axis) and bubble colours were assigned arbitrarily. The size of the bubbles illustrates the number of genes involved in each GO term, colour coded for biological process (red), cellular component (green) and molecular function (blue).
Fig. 2
Fig. 2. Time-course cluster analysis of the PfLS transcriptome.
a, Boxplot showing the expression trend of the 9 clusters identified in Extended Data Fig. 2c. The expression was further grouped into 5 major transcriptional profiles (I–V). Boxplots display the median (50th percentile), 75th and 25th percentiles (upper and lower hinges), and the largest and smallest value within 1.5× interquartile range (IQR) from the hinge (whiskers). b, GO term analysis of the genes with significant temporal expression changes in the five profiles. Bubbles represent unique GO terms (y-axis) and bubble colours were assigned arbitrarily. The size of the bubble illustrates the number of genes involved in each GO term, colour coded for biological process (red), cellular component (green) and molecular function (blue) (P < 0.01, Padj < 0.22). GO term enrichment analysis was computed using the hypergeometric test for overrepresentation, and Benjamini–Hochberg adjusted P values were used to account for multiple comparisons. c, Maximum-weight connected subgraphs (MWCS) of each profile, identifying functional modules. Nodes (proteins) identified within a time-course cluster have larger point size, while their interaction partners have smaller point size; node colours show the mean log2FC based on the colour bars in panel d, across days 4, 5 and 6 versus sporozoites. Edge weights represent the random forest classifier score, where higher scores indicate higher-confidence interactions; weights and protein complex IDs are those reported in ref. . d, log2FC of genes identified in protein-protein interaction (PPI) subnetworks associated with time/temporal changes in expression for days 4, 5 and 6 liver-stage samples when compared to sporozoites.
Fig. 3
Fig. 3. Motif enrichment analysis.
a, ApiAP2s (red). b, Newly identified orthologous transcription factors (TFs) (blue). Motif enrichment analysis was carried out for each timepoint cluster. Left: line plot illustrating the gene expression (log2CPM, y axis) trend within each cluster at each timepoint (x axis); individual points represent the mean gene expression per biological replicate (green ribbon). Ribbon widths display the mean ± s.d. expression across all replicates at each timepoint. Expression of the TF whose motif is most significantly enriched within that cluster is highlighted in the grey and non-green ribbons; points represent expression of the TF for each biological replicate and ribbon width is defined as above. Middle: heat map representing the log2 positive enrichment values of all TF motifs overrepresented in the cluster. Motif enrichment analysis was carried out using the binomial test with background sequences randomly sampled from the Pf genome; enrichment values represent the log2-transformed ratio of the observed number of sequences containing the TF motif. Motif enrichment analysis P values and Benjamini–Hochberg Padj for each cluster are reported in Supplementary Table 1. Right: the most highly enriched DNA motif for each cluster.
Fig. 4
Fig. 4. Expression of the PTEX translocon, and PEXEL and PNEP-encoding genes during LS development.
a, Normalized median expression values (log2TPM) of genes encoding the PTEX translocon across the course of LS development in 3 biological replicates. Boxplots display the median (50th percentile), 75th and 25th percentiles of expression (upper hinge and lower hinge), and the largest and smallest values within 1.5× IQR from the hinge (whiskers). b, Immunofluorescence images showing expression of PTEX components in PfLS schizonts from FRG huHep mice on day 7 PI. Top to bottom: anti-EXP2, anti-PTEX150 and anti-HSP101 (red). The sections were counterstained with DAPI (blue) and anti-PfCSP (green). Scale bar, 10 μm. c, Heat map displaying the Z-score of the mean TPM from the 3 biological replicates for genes encoding PEXEL and PNEP proteins on days 4, 5 and 6 PI. The accompanying pie charts illustrate the percentage of genes with peak expression on each of days 4, 5 and 6 PI (top) and the percentage across the combined 3 timepoints (bottom). d, Heat map demonstrating the Z-score of the TPM averages from the 3 biological replicates for genes encoding ‘Secreted + PLM (PEXEL-like motif)’ proteins on days 4, 5 and 6 PI. The accompanying pie charts illustrate the percentage of genes with peak expression on each of days 4, 5 and 6 PI (top) and the percentage across the combined 3 timepoints (bottom). LOGOs representing PEXEL residues used to identify the Secreted + PLM proteins. Highly conserved amino acids such as the initial arginine (R) are represented as larger letters, and more interchangeable residues appear smaller in the motif (top: canonical PEXEL motif, bottom: relaxed PEXEL motif).
Fig. 5
Fig. 5. PfLISP2 localization and gene deletion.
a, TPM values of CSP and LISP2 at days 2, 4 and 6 PI in 3 biological replicates. Data are presented as mean ± s.e.m. b, PfLS schizonts from FRG huHep mice immunostained with DAPI (blue), anti-CSP (green) and anti-LISP2 (red) at days 2, 4 and 6 PI. Scale bars, 10 μm. c, Comparison of the number of salivary gland sporozoites per mosquito between the PfNF54 line and Pflisp2. Each dot represents a biological replicate. Data are presented as mean ± s.e.m. d, Comparison of LS parasite size (based on area at the parasite’s largest circumference) between PfNF54 (3 mice) and Pflisp2 knockout parasites (15 mice) on days 6 and 7 PI. Data are presented as mean ± s.e.m. Statistical analysis was carried out using two-way analysis of variance (ANOVA) using a mixed-effects model (REML). ***P < 0.001, *P < 0.05, NSP > 0.05. e, Pflisp2 LS schizont from FRG huHep mice immunostained with DAPI (blue), anti-MSP1 (green) and anti-mTiP (red) at day 7 PI. Scale bar, 5 μm. f, Experimental design to analyse BS breakthrough of Pflisp2 on days 6 and 7 PI; huRBCs were injected intravenously to enable transition of LS parasites to BS infection. On day 7, mice were euthanized, blood was collected and used for RT–qPCR analysis to detect parasite 18S rRNA. The remaining blood was transferred to in vitro asexual parasite culture. Created with BioRender.com. g, Parasite BS densities in the blood of FRG huHep mice at the time of transition on day 7 PI, with 3 mice in the control group (PfNF54) and 15 mice in the Pflisp2 group. Data are presented as mean ± s.e.m.
Fig. 6
Fig. 6. Comparative transcriptome analysis of late Pf and Pv liver stages.
a, Venn diagram of orthologous genes expressed at ≥1 TPM in all 3 biological replicates of Pf or Pv. Overlapping section identifies genes detected in both Pf and Pv transcriptomes. b, Heat map illustrating the expression patterns of clonally variant gene families throughout the course of LS development. c, PfLS schizonts from FRG huHep mice immunostained with DAPI (blue), anti-PfHSP70 (red) and anti-PfATS (green) at day 7 PI. Scale bar, 10 μm. d, TPM values of a selection of gametocyte genes in the Pf and Pv datasets. Results are presented as mean ± s.d. of 3 independent experiments; **Padj = 0.007. e, RNA-FISH analysis of AP2-g (yellow) in PvLS schizont from FRG huHep mice at day 9 PI (top) and PfLS schizont from FRG huHep mice at day 7 PI (bottom). DNA of the parasites is visualized by DAPI staining (blue). Scale bar, 10 μm. f, Quantification of the number of PvLS and PfLS schizonts from FRG huHep mice at days 9 and 7 PI, respectively, expressing AP2-g by RNA-FISH. Results are presented as mean ± s.d. of 3 independent experiments; two-way ANOVA, ****P < 0.0001. g, Number of PfLS parasites positive for CSP and GFP recognizing PfNF54AP2GGFP parasites from FRG huHep mice at day 7 PI. Results are presented as mean ± s.e.m of 3 independent experiments; two-way ANOVA, ****P < 0.0001. h, Flow cytometry analysis of DNA dye+ (blue) and DNA dye+AP2-GFP+ (red) BS parasites following PfNF54AP2GGFP sporozoite infection in FRG huHep mice. The dotted line denotes the limit of detection (LOD), defined as the mean percentage of DNA dye+AP2-GFP+ events from the uninfected RBCs control. N = 3 mice. Results are combined and presented as mean ± s.e.m. of 2 independent experiments.
Extended Data Fig. 1
Extended Data Fig. 1. PfNF54CSPGFP parasites display normal characteristics throughout life cycle.
A) Strategy to generate the PfNF54CSPGFP parasite line. Black arrows indicate PCR primer binding location used for the diagnostic PCR analysis. Gel shows PCR results with primer sets to amplify recombinant DNA template of pCSP-GFP construct and show 5’ integration (primers 1 and 3), 3’ integration (primers 4 and 2) and wild type DNA template (primers 1 and 2). Primers for Pf18S rRNA were used as loading DNA control. B) Comparison of the infection prevalence, number of oocysts per midgut and salivary glands sporozoites per mosquito, between PfNF54CSPGFP line (fifteen individual mosquitoes’ infections) and PfNF54 WT parasites (nine individual mosquitoes’ infections). Data are presented as means ± SD for the first graph and median values for the remaining graphs. C) Live imaging of PfNF54CSPGFP in the mosquito stages to assess GFP expression, top panel day 11 midguts, middle panel day 14 salivary glands, lower panel day 15 dissected sporozoites. Scale bar 50 μm. D) Percent oocysts expressing GFP under CSP promoter observed in the midguts under fluorescent microscope on Day 7 and 11 post PfNF54CSPGFP infected blood feed to the mosquitoes. In two biological replicates. Data are presented as means ± SD. E) Western blot analysis of CSP and GFP expression in the lysate prepared from 1 million sporozoites and ten PfNF54CSPGFP infected mosquito midguts of Day 5, 7, 9 and 11 post infected blood feed. F) Pf18S rRNA measured at different time point by qRT-PCR after the blood was collected from FRGhuHep mice infected with PfNF54CSPGFP on day 7 post sporozoite infection and then cultured in vitro.
Extended Data Fig. 2
Extended Data Fig. 2. Liver stage transcriptome.
A) Representative FACS gating. i) Forward and side scatter gating based on general size to find hepatocytes. ii) Gating to distinguish single cells from doublets. iii) Live hepatocytes gating based on DAPI. iv) Gating of infected primary hepatocytes based on GFP content. B) Bubble plot showing GO term analysis of the enriched genes in Pf sporozoites (p < 0.06, adj. p < 0.23). Bubbles represent unique GO terms (y-axis) and bubble colours were assigned arbitrarily. The size of the bubbles display by different biological processes is positively correlated with the number of genes involved in each pathway. Color-coded (pink) biological process, (green) cellular component and (blue) molecular function. C) Heatmap showing time course cluster analysis of Pf sporozoites (red), Day 4 (light blue), Day 5 (green) and Day 6 (dark blue). Gene expression values are shown as Z-scores. D) Line-graph showing TPM expression of lisp1 and AP2-EXP2 during the progression of LS development. In three biological replicates. Data are presented as means ± SD. E) RNA-FISH analysis of AP2-EXP2 (green) and LISP1 (magenta) in PfLS schizont from FRGhuHep mice at Day 7 PI. DNA of the parasites is visualized by DAPI staining (blue). Scale bar: 10 μm.
Extended Data Fig. 3
Extended Data Fig. 3. AP2s expression in the liver stage.
A) Heatmap displaying the AP2 motifs that are enriched in upregulated and downregulated DEGs at the early time point (Day 2 PI) vs sporozoites, and on the right, it showcases the corresponding enriched DNA motifs identified. B) Heatmap showing the expression levels of all AP2 genes during the progression of LS development. C) Line plot depicting the gene expression trends of AP2 genes within each cluster exhibiting enriched motifs.
Extended Data Fig. 4
Extended Data Fig. 4. Analysis of PfLS exportome.
A) Heatmap displaying the Z-scores for TPM averages from the three biological replicates are displayed for genes encoding PEXEL, PNEP and ‘Secreted + PLM’ proteins on Day 2, 4, 5 and 6 PI. The accompanying pie chart illustrates the percentage of genes with peak expression on Day 2 PI.
Extended Data Fig. 5
Extended Data Fig. 5. Pf lisp2 parasites analysis.
A) The schematic depicts generation of Pflisp2 via CRISPR/Cas9-mediated gene editing. Primers used for confirming parasite genotypes are shown and the length of PCR amplicons are indicated in the table. The agarose gel electrophoresis indicates gene deletion of Pf lisp2 in two clones A3 and H1. Expected amplicon sizes for WT and PfLARC2 and the pFC plasmid are indicated in the schematic. B) The schematic and the corresponding Southern blot for the Pf NF54 and Pflisp2 locus. Genomic DNA from Pf NF54 and Pflisp2 clones A3 and H1 was digested with SpeI and HindIII and probed with a 5′ LISP2 probe to confirm gene deletion of Pf LISP2. C) Asexual BS parasitemia is compared between Pf NF54 (black line) and Pflisp2 clones A3 (green line) and H1 (red line) over three replication cycles. Data represent mean ± SD. n = 3 biological replicates. Statistical analysis was carried out using 2-way ANOVA. ns, not significant. P > 0.05 is taken as ns. Graphs comparing (D) Immunostaining of Pflisp2 schizont from FRGhuHep mice at Day 6 PI, immunostained with DAPI (blue), anti-CSP (green) and anti-LISP2 (red). Scale bar corresponds to 10 μm.
Extended Data Fig. 6
Extended Data Fig. 6. P. falciparum and P. vivax expressed orthologues and pathways.
A) Density plot showing the mean gene expression (log2TPM) aligning against H. sapiens (purple) and P. vivax (blue). B) Bubble plot showing GO term analysis of the expressed genes in Pf and Pv (p < 0.06, adj. p < 0.23), GO terms enriched (p < 0.06, adj. p < 0.19) in genes expressed only in PvLS transcriptome and terms enriched (p < 0.03, adj. p < 0.21) in those expressed only in Pf. The size of the circles display by different biological processes is positively correlated with the number of genes involved in each pathway. Color-coded (pink) biological process, (green) cellular component and (blue) molecular function. C) RNA-seq shows var gene transcription during PfLS at day 6 PI. Data are presented as median value of three biological replicates. the box limits are the upper and lower quartiles. Transcripts corresponding to each var gene (shown on the x axis) are indicated as log2TPM, indicated on the y axis. Boxplots (box and whiskers plot) display the median (50th percentile), upper hinge as the 75th percentile, and lower hinge as the 25th percentile of expression; whiskers extend from the hinge to the largest or smallest value within 1.5 * IQR (interquartile range) from the hinge, respectively. D) Heatmap illustrating the expression patterns of P. vivax clonally variant gene families in the three biological replicates.
Extended Data Fig. 7
Extended Data Fig. 7. AP2s expression in Pf liver stage.
A) RNA-FISH analysis of AP2-g (yellow) in PfNF54 enriched schizonts to assess probe specificity. DNA of the parasites is visualized by DAPI staining (blue). Scale bar: 10 μm. B) The Agarose gel electrophoresis indicates six clones of the PfNF54AP2GGFP transgenic parasite line. Clone G8 (bold) was selected for further propagation and used in functional assays. C) Sexual conversion assay of the PfNF54AP2GGFP G8 clone, was performed to estimate the sexual conversion rate (CR) and the parasite multiplication rate (PMR) in comparison with NF54 WT. D) Analysis of the infection prevalence, number of oocysts per midgut and salivary glands sporozoites per mosquito, of PfNF54AP2GGFP line. In two biological replicates. E) Immunostaining of PfNF54AP2GGFP erythrocytic enriched schizonts (i) and PfLS schizont from FRGhuHep mice at Day 7 PI (ii), immunostained with DAPI (blue), anti-GFP (green) and anti-MSP2 or anti-CSP (red). Scale bar corresponds to 10 μm. F) Gating strategy. Single cells were gated based on side scatter (SSC-H vs SSC-A) followed by gating on the red blood cells. Any possible white blood cells were avoided from further analysis by gating on CD45 negative population. Finally, the BS parasites were gated based on positive DNA staining by SPY650-DNA dye, whereas AP2 expressing parasites were gated based on positive DNA staining and GFP content. G) Representing flow layouts. N=3 mice. Results are combined and presented as means ±SEM from two independent experiments. Source data are provided as a Source data file.

Similar articles

Cited by

References

    1. World Malaria Report 2022. (World Health Organization, 2022); https://www.who.int/publications/i/item/9789240064898
    1. Roux, A. T. et al. Chloroquine and sulfadoxine-pyrimethamine resistance in sub-Saharan Africa—a review. Front. Genet.12, 668574 (2021). - PMC - PubMed
    1. Ashley, E. A. et al. Spread of artemisinin resistance in Plasmodium falciparum malaria. N. Engl. J. Med.371, 411–423 (2014). - PMC - PubMed
    1. Vaughan, A. M. & Kappe, S. H. I. Malaria parasite liver infection and exoerythrocytic biology. Cold Spring Harb. Perspect. Med.7, a025486 (2017). - PMC - PubMed
    1. Graumans, W., Jacobs, E., Bousema, T. & Sinnis, P. When is a Plasmodium-infected mosquito an infectious mosquito? Trends Parasitol.36, 705–716 (2020). - PMC - PubMed

LinkOut - more resources