. 2025 Jan 31;22(1):27.
doi: 10.1186/s12974-025-03350-5.

Exploratory analysis of a Novel RACK1 mutation and its potential role in epileptic seizures via Microglia activation

Affiliations

Exploratory analysis of a Novel RACK1 mutation and its potential role in epileptic seizures via Microglia activation

Sai Zhang et al. J Neuroinflammation. .

Abstract

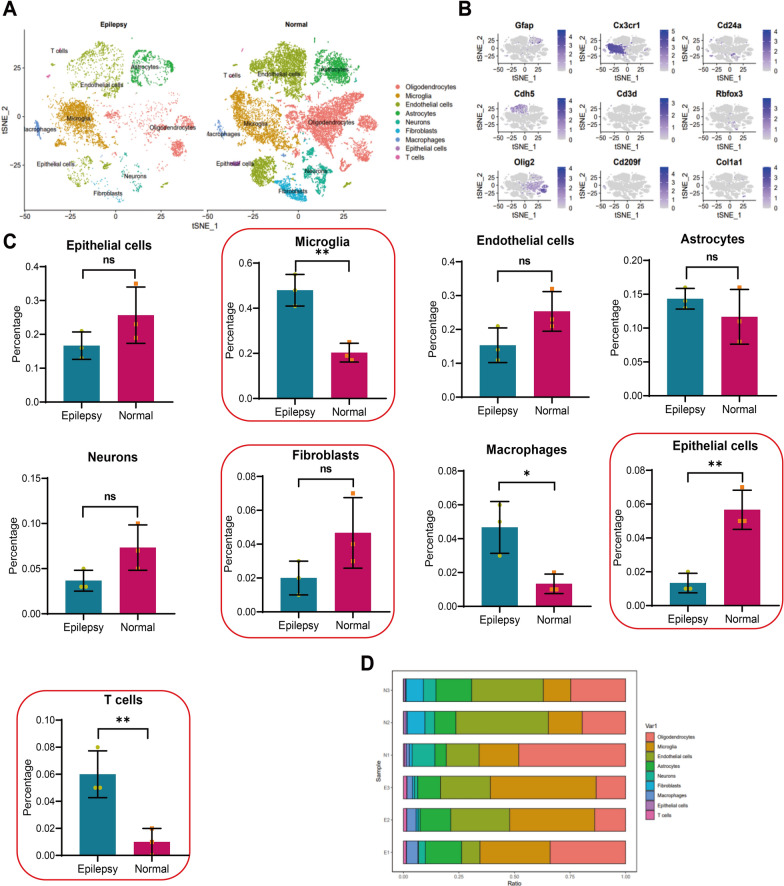
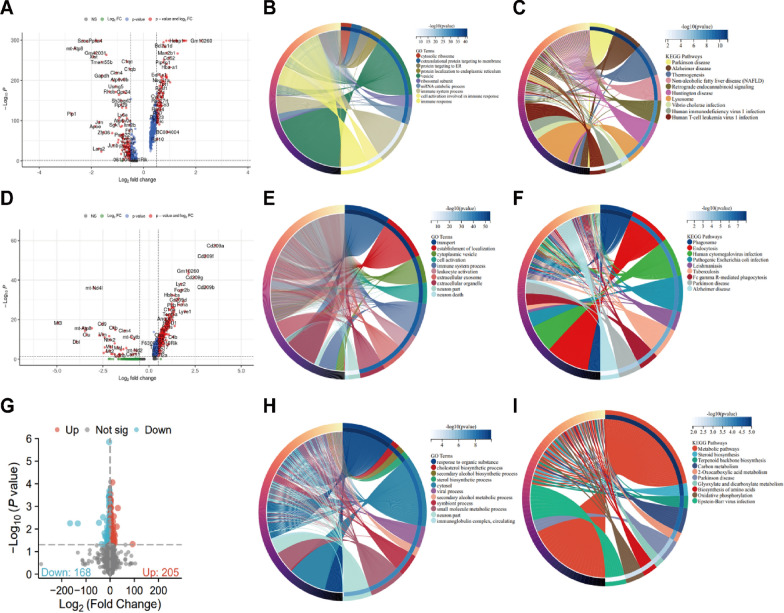
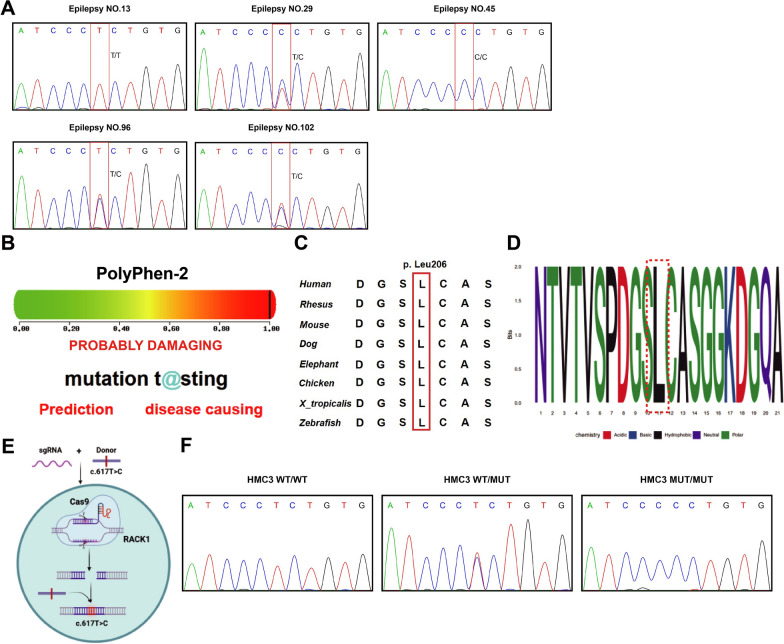
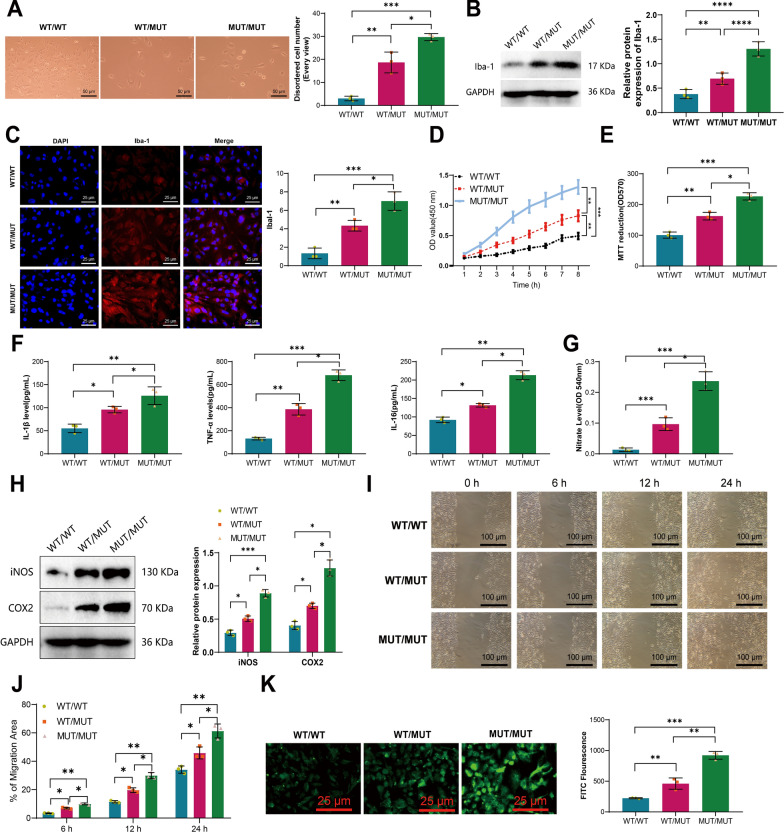
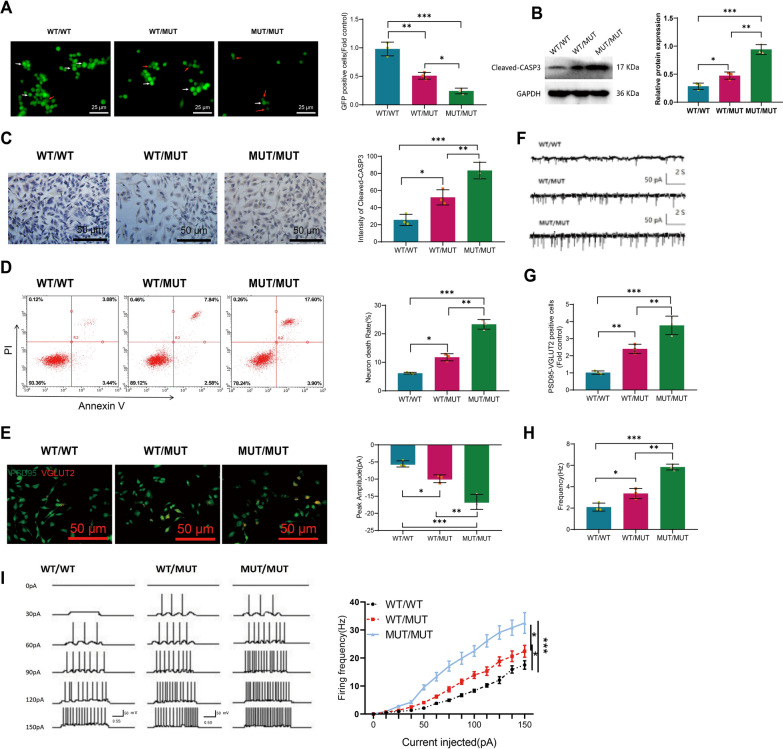
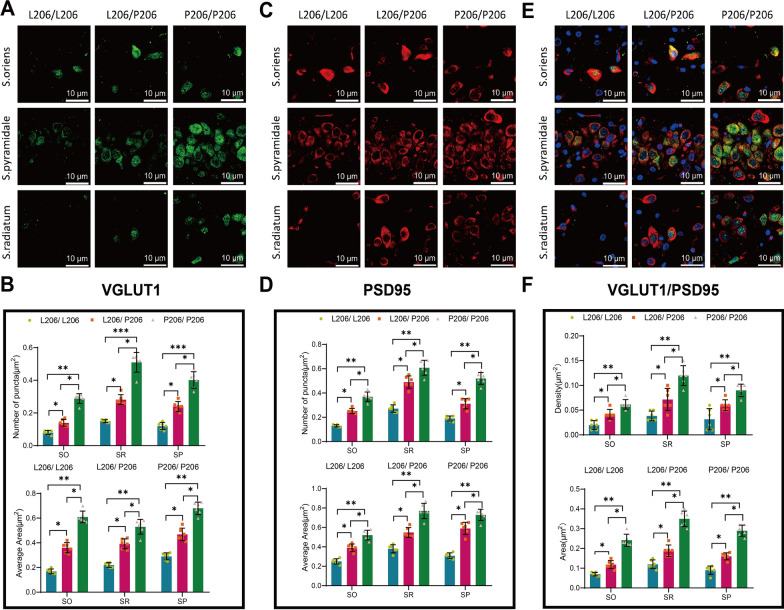
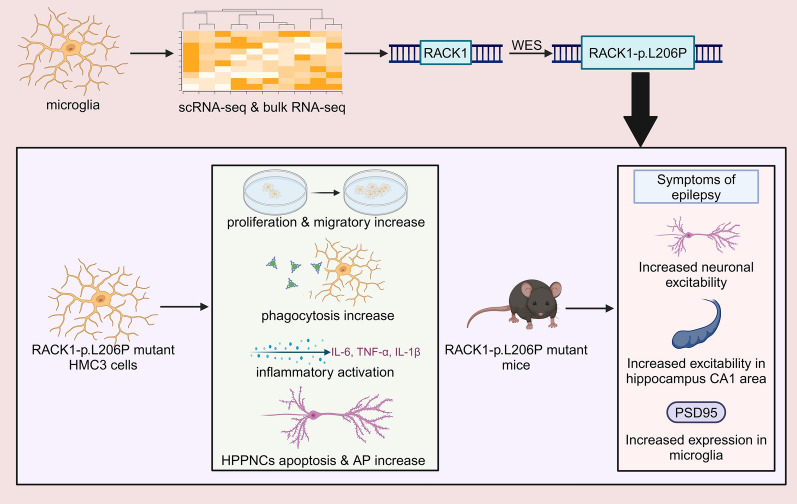
Seizures is a prevalent neurological disorder with a largely elusive pathogenesis. In this study, we identified the key gene RACK1 and its novel mutation RACK1-p.L206P as being associated with seizures through single-cell transcriptome sequencing (scRNA-seq) and whole exome sequencing (WES) techniques. Our findings reveal that the RACK1-p.L206P mutation significantly enhances proliferation, migration, phagocytic ability, and inflammatory activation in human microglia, which in turn affects neuronal excitability and synaptic function, culminating in typical seizure symptoms in the seizures. These effects were further validated in a mouse model using CRISPR/Cas9 gene editing technology. Mutant microglia exhibited increased activation and induced apoptosis in hippocampal neurons, leading to higher action potential frequency and excitatory synaptic marker expression. In vivo experiments demonstrated that RACK1-p.L206P mutant mice displayed classic seizure symptoms, with increased neuronal excitability and a tendency for action potential bursts during initial depolarization, along with more frequent spike discharges. Additionally, excitatory synapse density and size in the hippocampal CA1 region of mutant mice were significantly elevated, accompanied by increased expression of VGLUT1 and PSD95 within microglia. This study offers novel insights into the molecular mechanisms underlying seizures in the seizures and presents valuable clues for the development of future therapeutic strategies.

Keywords: CRISPR/Cas9; Microglia; Neuron; RACK1; Seizures; Whole exome sequencing.


Conflict of interest statement

Declarations. Ethics approval and consent to participate: All animal experiments conducted in this study were approved by the Institutional Animal Care and Use Committee (IACUC) of Sun Yat-sen University (Approval No. SYSU-IACUC-2020-B0278). Competing interests: The authors declare no competing interests.

Figures

Fig. 1
Fig. 1
Cell Annotation and Differential Analysis of scRNA-seq Data. A Visualization of cell annotation results based on t-SNE clustering, where each color represents a cell subtype; B Expression patterns of 9 cell marker genes across different cell subtypes, with darker blue indicating higher average expression levels; C Differential analysis of cell composition between Normal and seizure samples using T-test (Normal, n = 3; seizures, n = 3), cells with significant differences are highlighted by a red dashed box, “ns” indicates no difference, * indicates P < 0.05, ** indicates P < 0.01; D Percentage of different cell subtypes in each sample, represented by different colors
Fig. 2
Fig. 2
Cell Communication and Pseudo-Temporal Analysis in scRNA-seq. A−B Network plots of cell communication in Normal (A) and seizures (B) samples, where the thickness of lines on the left side represents the number of pathways, and on the right side represents interaction strength; C−D Separate distinctions of interactions for each cell in Normal (C) and seizures (D) samples; E Trajectory skeleton plot colored by pseudo-temporal states, including branches (states), branch nodes (①, ②), each point representing a cell; F Trajectory skeleton plot colored by cell types
Fig. 3
Fig. 3
Analysis of Differential Genes and Functional Enrichment. A Volcano plot showing differential genes in small glial cells in scRNA-seq, red dashed lines indicate genes with lower expression in the seizures group on the left side and higher expression on the right side; B−C Circos plots of functional enrichment analysis for GO (B) and KEGG (C) of differential genes in small glial cells; D Volcano plot showing differential genes in macrophages in scRNA-seq, red dashed lines indicate genes with lower expression in the seizures group on the left side and higher expression on the right side; E−F Circos plots of functional enrichment analysis for GO (E) and KEGG (F) of differential genes in macrophages; G Volcano plot of differential genes in Bulk RNA-seq, red represents significantly upregulated genes, blue represents significantly downregulated genes, and gray indicates genes with no significant difference; H−I Circos plots of functional enrichment analysis for GO (H) and KEGG (I) of differential genes in Bulk RNA-seq
Fig. 4
Fig. 4
Identification of Key Genes through Integrated scRNA-seq and Bulk RNA-seq. A Venn diagrams displaying genes related to seizures downloaded from GeneCards, differential genes in microglias, differential genes in macrophages, and differential genes from Bulk RNA-seq; B−C Violin plots illustrating the expression of Rack1 in microglias (B) and macrophages (C) in scRNA-seq data (Normal, n = 3; seizures, n = 3); D Box plots showing the expression of Rack1 in Bulk RNA-seq data (Normal, n = 3; seizures, n = 3); E Biased jitter plot of Rack1 expression distribution, with cell types on the horizontal axis and gene expression levels on the vertical axis; F Presentation of gene expression changes along pseudo-temporal states, color-coded by cell types; G Immunohistochemical staining to detect the expression of RACK1 protein in mouse brain tissue, scale bar = 50 μm, the graph on the right shows the statistics of positive cells, the experiment was repeated thrice, and values are presented as mean ± standard deviation, *** indicates P < 0.001
Fig. 5
Fig. 5
Screening for Mutations in RACK1 among Epileptic Patients. A Sanger sequencing data of RACK1 Exon 5 in 5 epileptic patients; B Predictions of the harmfulness of the c.617T > C mutation in RACK1 from PolyPhen-2 and Mutation Taster databases; C Conservation analysis of p.Leu206 in 8 species including human, rat, and mouse; D Conservation visualization of 21 amino acids using R package; E Process diagram illustrating the establishment of RACK1-p.L206P heterozygous and homozygous KI mutants using CRISPR/Cas9 editing system in HMC3; F Sanger sequencing confirmation of RACK1 mutations in allele gene cell lines
Fig. 6
Fig. 6
Evaluation of Activity and Inflammatory Activation in Cells with Different Genotypes. A Observation of morphological changes in HMC3 cells of different genotypes under an optical microscope, scale bar = 50 μm, the graph on the right shows the statistical count of irregularly shaped cells in one field of view; B Western blot analysis of Ibal-1 expression; C Immunofluorescence detection of Ibal-1 in HMC3 cells, scale bar = 25 μm, the graph on the right shows the statistics of Ibal-1 positive cells; D CCK-8 assay for cell proliferation; E MTT assay for cell viability; F ELISA measurement of pro-inflammatory cytokine levels in cell culture medium; G Griess reagent assay for nitrite content determination; H Western blot analysis of iNOS and COX2 expression levels; I−J Imaging of HMC3 cells migrating to the scratch area at different time points of 6 h, 12 h, and 24 h, scale bar = 100 μm, calculation of the percentage of migrating cells in the area using Image J software (H); K Fluorescence microscopy observation of pHrodo™ Green E. coli particles and quantitative analysis, scale bar = 25 μm. All cell experiments were repeated three times, and values are presented as mean ± standard deviation, * indicates P < 0.05, **indicates P < 0.01, *** indicates P < 0.001
Fig. 7
Fig. 7
Exploring the Impact of Different Genotypes of HMC3 Cells on HPPNCs. A Fluorescence image of GFP-labeled HPPNCs cells, with red arrows indicating neurons that died during the experiment and white arrows indicating neurons that survived until the end of the experiment. The right image shows a statistical graph of GFP-positive cells, scale bar = 25 μm. B Quantification of Cleaved-CASP3 expression by Western blot. C Immunohistochemical detection of Cleaved-CASP3 expression, scale bar = 50 μm, with the right image showing a statistical graph of positive cells. D Detection of apoptosis in HPPNCs cells using flow cytometry, with the right image showing a statistical graph of apoptotic cell numbers. E Immunofluorescence detection of PSD95/VGLUT2 colocalization in HPPNCs cells, scale bar = 5 μm, with the right image showing a statistical graph of PSD95/VGLUT2 positive cells. F−H Whole-cell patch-clamp recordings of sEPSCs (F), analysis and comparison of sEPSC amplitudes (G) and frequencies (H). I Representative AP traces of neurons under different currents, displaying the firing frequency of AP in neurons with injected currents ranging from 0 to 150 pA. All cell experiments were repeated three times, and values are presented as mean ± standard deviation. * indicates P < 0.05, ** indicates P < 0.01, *** indicates P < 0.001
Fig. 8
Fig. 8
Analysis of Seizure Phenotypes in Mice with Different Genotypes. A Sanger sequencing of three different genotypes of mice. B−C Quantification of Rack1 expression in the Hipp of mice with different genotypes using RT-qPCR (B) and Western blot (C), with 6 mice in each group. D Limb clasping during tail suspension test, with the left image showing a negative response and the right image showing a positive response. E Bar graph depicting the number of negative and positive responses in tail suspension test for mice of different genotypes, with 30 mice in each group. F Steps for audiogenic seizure induction (left) and bar graph showing the number of mice with audiogenic seizures for different genotypes, with 30 mice in each group. G SHIRPA abnormality scores for 30 mice in each group. H−I Total seizure counts (H) and total duration of seizures during EEG monitoring (I) for different genotypes: P206/P206: n = 21, L206/P206: n = 15, L206/L206: n = 20. J The single spike at the onset of seizure followed by irregular spike-wave patterns. K Rapid rhythmic activities with fluctuating amplitudes. L Bar graph showing rapid rhythmic waveforms in two mutant mouse groups, P206/P206: n = 20, L206/P206: n = 13. Values are presented as mean ± standard deviation. * indicates P < 0.05, ** indicates P < 0.01, *** indicates P < 0.001
Fig. 9
Fig. 9
Revealing the Effects of RACK1-p.L206P Mutation on Phagocytic Function and Inflammatory Response in Microglial Cells. A Immunofluorescence detection of Rack1 and Iba-1 expression in the mouse Hipp, scale bar = 100 μm, with the right image displaying a statistical graph of positive cells. B Confocal microscopy examination of phagocytic capability in microglial cells, with yellow arrows indicating phagocytic cell bodies and red asterisks representing microglial cell nuclei labeled with Hoechst, scale bar = 25 μm, and the right image showing a statistical graph of microglial cells with phagocytic ability. C−D Quantification of MerTK and Rab7 expression in the mouse Hipp using RT-qPCR (C) and Western blot (D). E ELISA measurement of TNF-α, IL-1β, and IL-6 levels in the mouse Hipp. F Immunofluorescence detection of IL-1β and Iba-1 colocalization in the mouse Hipp, scale bar = 15 μm, with the right image displaying a statistical graph of positive cells. G−H Assessment of iNOS and COX2 expression in the mouse Hipp through RT-qPCR (G) and Western blot (H). Each group consisted of 6 mice, and values are expressed as mean ± standard deviation. * indicates P < 0.05, ** indicates P < 0.01, *** indicates P < 0.001
Fig. 10
Fig. 10
Impact of RACK1-p.L206P Mutation on Excitability of Mouse Hippocampalocampal Neurons. A Under a maintaining voltage of − 65 mV, injection of a stepwise increasing current with an amplitude of 300 ms triggered representative AP traces; B Graph comparing AP frequencies with injected currents; C Graph depicting the maximal hyperpolarization voltage between AP induced by the injection of a depolarizing current of 270 pA; D Brief stimulation causing a synaptic AP burst; E Response of AP peak frequency to synaptic stimulation; F Area under the curve (AUC) for synaptic-induced AP. Each group consisted of six mice, with values presented as mean ± standard deviation. * P < 0.05, ** P < 0.01, and *** P < 0.001
Fig. 11
Fig. 11
Exploring Alterations in Excitatory Synapses of Different Genotypes of Mice. A−D Immunofluorescent images of VGLUT1 (A) and PSD95 (C) in the hippocampalocampal CA1 region layers (SO, SP, and SR), with a scale bar of 10 μm. Quantitative statistical graphs of synaptic density and area are shown in B and D, respectively. E−F Co-localization of VGLUT1/PSD95 in the hippocampalocampal CA1 region layers (SO, SP, and SR), with white circles representing co-localization points and a scale bar of 10 μm. Quantitative statistical graphs of density and area are presented in F. Each group consisted of 6 mice, with mean ± standard deviation values. * indicates P < 0.05, ** indicates P < 0.01, *** indicates P < 0.001
Fig. 12
Fig. 12
Molecular Mechanisms Underlying Seizure Occurrence Induced by RACK1-p.L206P Mutation in Mice

References

    1. Avcu G, Kilinc MA, Eraslan C, Karapinar B, Vardar F. Mild encephalitis/encephalopathy with reversible splenial lesion (MERS) associated with Streptococcus pneumoniae Bacteraemia. J Infect Public Health. 2017;10(4):479–82. 10.1016/j.jiph.2016.08.019. - PMC - PubMed
    1. Stafstrom CE, Carmant L. Seizures and epilepsy: an overview for neuroscientists. Cold Spring Harb Perspect Med. 2015;5(6):a022426. 10.1101/cshperspect.a022426. Published 2015 Jun 1. - PMC - PubMed
    1. Brolin RE, Semmlow JL, Sehonanda A, et al. Comparison of five methods of assessment of intestinal viability. Surg Gynecol Obstet. 1989;168(1):6–12. - PubMed
    1. Yacubian EMT, Kakooza-Mwesige A, Singh G, et al. Common infectious and parasitic diseases as a cause of seizures: geographic distribution and contribution to the burden of epilepsy. Common infectious and parasitic diseases as a cause of seizures: geographic distribution and contribution to the burden of epilepsy. Epileptic Disord. 2022;24(6):994–1019. 10.1684/epd.2022.1491. - PubMed
    1. Slyper M, Porter CBM, Ashenberg O, et al. A single-cell and single-nucleus RNA-Seq toolbox for fresh and frozen human tumors [published correction appears in Nat Med. 2020 Aug;26(8):1307. doi: 10.1038/s41591-020-0976-3]. Nat Med. 2020;26(5):792–802. 10.1038/s41591-020-0844-1. - PMC - PubMed