Multicenter Study
. 2025 Feb;31(2):140-158.
doi: 10.1177/13524585241307154. Epub 2024 Dec 31.

Use of brain MRI and gene expression atlases to reconstruct the pathophysiology of autoimmune neurological disorders: The proof-of-concept of NMOSD

Affiliations
Multicenter Study

Use of brain MRI and gene expression atlases to reconstruct the pathophysiology of autoimmune neurological disorders: The proof-of-concept of NMOSD

Laura Cacciaguerra et al. Mult Scler. 2025 Feb.

Abstract

Background: The understanding of disease pathophysiology is pivotal for tailored treatments. The spatial distribution of brain damage relies on the regional antigen expression and the local balance of susceptibility and protective elements.

Objective: As proof-of-concept, we investigated the spatial association between brain damage and gene expression in aquaporin-4-IgG-positive neuromyelitis optica spectrum disorder (AQP4 + NMOSD).

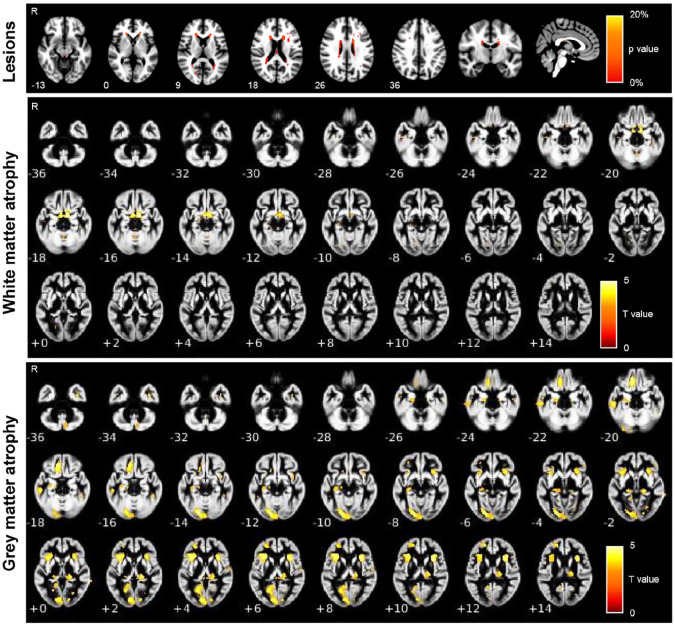
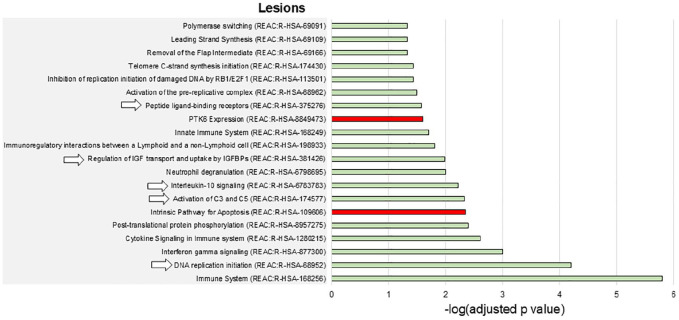
Methods: In this multicenter cross-sectional study, 90 AQP4 + NMOSD patients and 94 age-matched healthy controls underwent a brain magnetic resonance imaging (MRI). We used T2-hyperintense lesion probability maps and white/gray matter atrophy as proxies of inflammation and neurodegeneration. The association with the expression of 266 candidate genes was obtained with the Multimodal Environment for Neuroimaging and Genomic Analysis platform. A functional-enrichment analysis investigated overrepresented biological processes.

Results: In AQP4 + NMOSD, T2-hyperintense lesions were mainly periventricular; atrophy mostly involved the visual pathway. The expression of AQP4 and complement (C4a and C5) was associated with both inflammation and neurodegeneration. Complement activation and regulation/uptake of the insulin-like growth factor were the most relevant enriched pathways. Nonspecific pathways related to DNA synthesis and repair were associated with brain atrophy.

Conclusions: Quantitative MRI and gene expression atlas identified the key elements of AQP4 + NMOSD pathophysiology. This analysis could help in understanding the pathophysiology of antibody-mediated autoimmune disorders.

Keywords: Neuromyelitis optica spectrum disorders; gene expression; magnetic resonance imaging.


Conflict of interest statement

Declaration of Conflicting InterestsThe author(s) declared the following potential conflicts of interest with respect to the research, authorship, and/or publication of this article: L.C. received speaker and consultant honoraria from ACCMED, Roche, BMS Celgene, and Sanofi. L.S. received grants and contracts from FISM—Fondazione Italiana Sclerosi Multipla—within a fellowship program (cod. 2019/BR/009) and received speakers’ honoraria from Biogen. E.P. received speaker honoraria from Biogen Idec. P.P. received speaker honoraria from Roche, Biogen, Novartis, Merck Serono, Bristol-Myers Squibb, Genzyme, Horizon, and Sanofi; he received research support from the Italian Ministry of Health and Fondazione Italiana Sclerosi Multipla. S.M. has been an advisor or speaker for Medis, Merck, Teva, Hemofarm, and Roche. V.M. received honoraria for consulting services or speaking activity from Biogen, Merck, Novartis, TEVA, Almirall, and Sanofi. L.M. received compensation for speaking activities, and/or consulting services from Merck, Biogen, Novartis, Roche, Sanofi, and TEVA. M.R. reports no disclosures. J.I. reports no disclosures. O.T. has been a speaker for Medis, Merck, Teva, Hemofarm, Novartis, and Roche. J.D. has been an advisor or speaker for Bayer HealthCare, Sanofi-Genzyme, Medis, Merck, Teva, Novartis, Biogen, Hemofarm, and Roche. M.F. is Editor-in-Chief of the Journal of Neurology, Associate Editor of Human Brain Mapping, Neurological Sciences, and Radiology; he received compensation for consulting services from Alexion, Almirall, Biogen, Merck, Novartis, Roche, and Sanofi; speaking activities from Bayer, Biogen, Celgene, Chiesi Italia SpA, Eli Lilly, Genzyme, Janssen, Merck-Serono, Neopharmed Gentili, Novartis, Novo Nordisk, Roche, Sanofi, Takeda, and TEVA; participation in Advisory Boards for Alexion, Biogen, Bristol-Myers Squibb, Merck, Novartis, Roche, Sanofi, Sanofi-Aventis, Sanofi-Genzyme, and Takeda; scientific direction of educational events for Biogen, Merck, Roche, Celgene, Bristol-Myers Squibb, Lilly, Novartis, Sanofi-Genzyme; he receives research support from Biogen Idec, Merck-Serono, Novartis, Roche, the Italian Ministry of Health, the Italian Ministry of University and Research, and Fondazione Italiana Sclerosi Multipla. M.A.R. received consulting fees from Biogen, Bristol Myers Squibb, Eli Lilly, and Janssen, Roche; and speaker honoraria from AstraZeneca, Biogen, Bristol Myers Squibb, Bromatech, Celgene, Genzyme, Horizon Therapeutics Italy, Merck Serono SpA, Novartis, Roche, Sanofi, and Teva. She receives research support from the MS Society of Canada, the Italian Ministry of Health, the Italian Ministry of University and Research, and Fondazione Italiana Sclerosi Multipla. She is Associate Editor for Multiple Sclerosis and Related Disorders.

Figures

Figure 1.
Figure 1.
Spatial location of T2-hyperintense lesions, gray matter atrophy, and white matter atrophy in AQP4 + NMOSD patients. Atrophy T maps refer to age-, sex-, scanner-, and V-scaling-adjusted full factorial models (AQP4 + NMOSD vs HC, p < 0.001). Numbers refer to the z coordinates according to the MNI system. Abbreviations: R: right; MNI: Montreal Neurological Institute.
Figure 2.
Figure 2.
Heatmap of spatial association between gene expression, T2-hyperintense lesions, and gray matter atrophy in AQP4 + NMOSD patients. Positive correlations (i.e. the highest the expression of the gene, the highest the probability of a focal lesion/T value of gray matter atrophy) are color-coded green, while negative correlations (i.e. the highest the expression of the gene, the lowest the probability of a focal lesion/T value of gray matter atrophy) are color-coded red. Nonsignificant correlations are light gray. Genes positively correlated with both lesions and gray matter atrophy are shown in bold and indicated by a+; genes negative correlated with both lesions and gray matter atrophy are shown in bold and indicated by a-.
Figure 3.
Figure 3.
Enriched biological pathways associated with T2-hyperintense lesions in AQP4 + NMOSD. The barcharts show the enriched biological pathways positively (green bars) or negatively (red bars) associated with T2-hyperintense lesions in AQP4 + NMOSD. Numbers on the x axes are -log(Bonferroni-adjusted p values) of the enrichment analysis. The pathways indicated by arrows are also positively associated with the presence of gray matter atrophy. None of the pathways negatively associated with T2-hyperintense lesions was also negatively associated with gray matter atrophy. Abbreviations: REAC: reactome pathways database.
Figure 4.
Figure 4.
Enriched biological pathways associated with gray matter atrophy in AQP4 + NMOSD. The barcharts show the enriched biological pathways positively (green bars) or negatively (red bars) associated with gray matter atrophy in AQP4 + NMOSD. Numbers on the x axes are -log(Bonferroni-adjusted p values) of the enrichment analysis. The pathways indicated by arrows are also positively associated with the presence of T2-hyperintense lesions. None of the pathways negatively associated with gray matter atrophy was also negatively associated with T2-hyperintense lesions. Abbreviations: REAC: reactome pathways database.
Figure 5.
Figure 5.
Network of the enriched biological pathways involved in brain damage of AQP4 + NMOSD. Each node represents one of the enriched biological pathways, and their size represents the size of the pathway. Edge width represents the number of genes shared by connected pathways. Green nodes indicate enriched pathways positively associated with the development of brain damage (dark green indicates the pathways involved in both T2-hyperintense lesions and gray matter atrophy formation). Red nodes indicate enriched pathways negatively associated with the development of brain damage. White nodes indicate enriched pathways showing both positive and negative associations with brain damage. Abbreviations: IGF: insulin-like growth factor; IGFBPs: insulin-like growth factor-binding proteins; IL: interleukin; REAC: reactome pathways database.

References

    1. Lennon VA, Kryzer TJ, Pittock SJ, et al.. IgG marker of optic-spinal multiple sclerosis binds to the aquaporin-4 water channel. J Exp Med 2005; 202: 473–477. - PMC - PubMed
    1. Lucchinetti CF, Mandler RN, McGavern D, et al.. A role for humoral mechanisms in the pathogenesis of devic’s neuromyelitis optica. Brain 2002; 125: 1450–1461. - PMC - PubMed
    1. Papadopoulos MC, Verkman AS. Aquaporin 4 and neuromyelitis optica. Lancet Neurol 2012; 11: 535–544. - PMC - PubMed
    1. Traboulsee A, Greenberg BM, Bennett JL, et al.. Safety and efficacy of satralizumab monotherapy in neuromyelitis optica spectrum disorder: A randomised, double-blind, multicentre, placebo-controlled phase 3 trial. Lancet Neurol 2020; 19: 402–412. - PMC - PubMed
    1. Yamamura T, Kleiter I, Fujihara K, et al.. Trial of satralizumab in neuromyelitis optica spectrum disorder. N Engl J Med 2019; 381: 2114–2124. - PubMed

Publication types

LinkOut - more resources