. 2025 Feb 12;5(2):100764.
doi: 10.1016/j.xgen.2025.100764. Epub 2025 Jan 31.

Defining hypoxia in cancer: A landmark evaluation of hypoxia gene expression signatures

Affiliations

Defining hypoxia in cancer: A landmark evaluation of hypoxia gene expression signatures

Matteo Di Giovannantonio et al. Cell Genom. .

Abstract

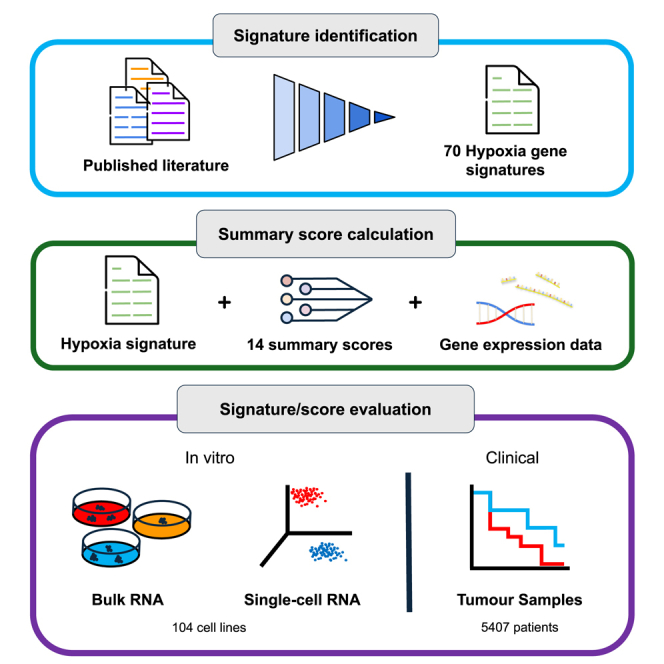
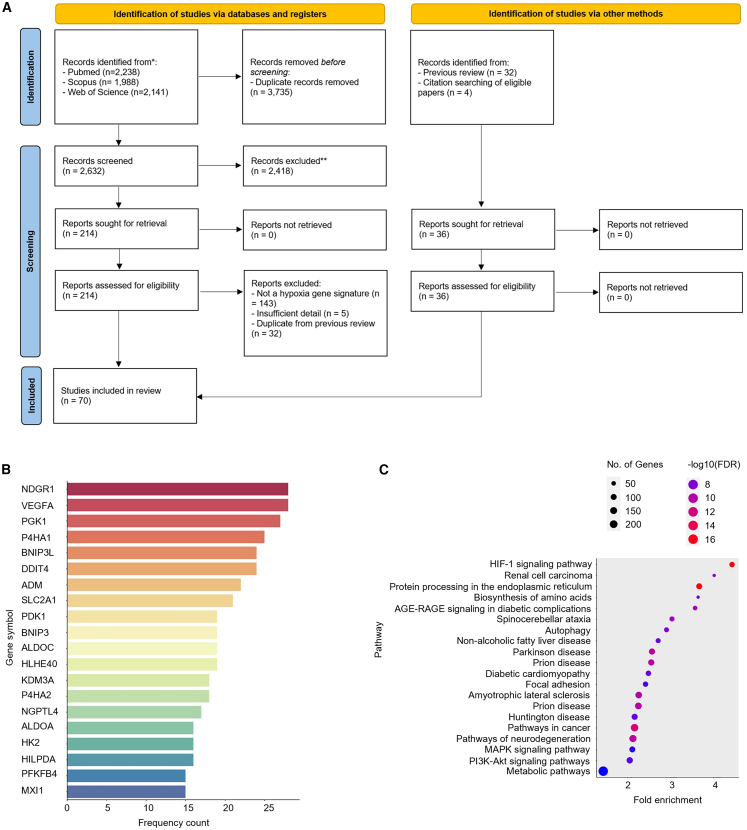
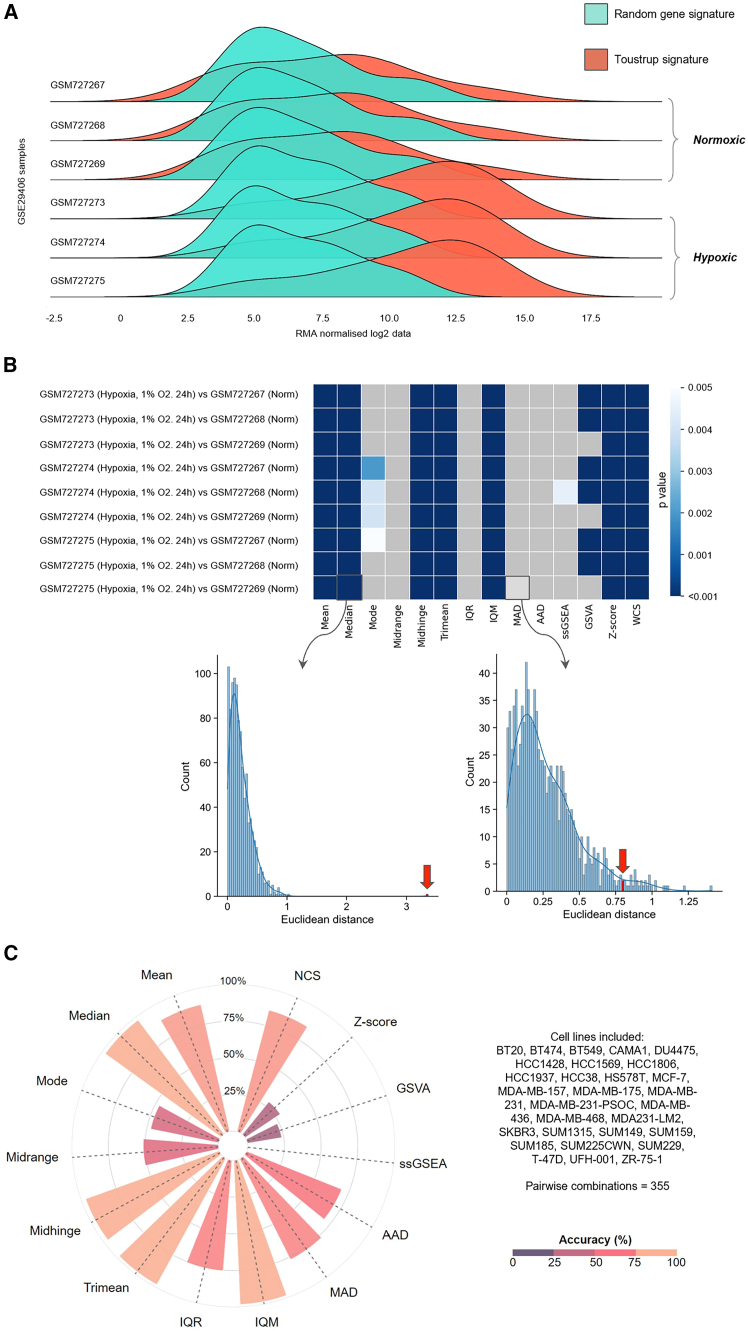
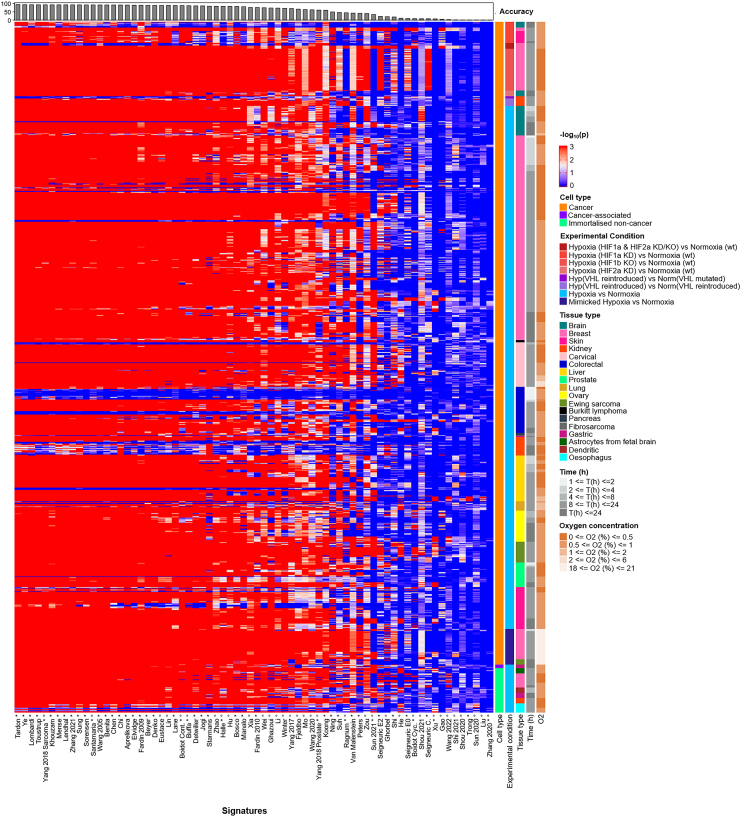
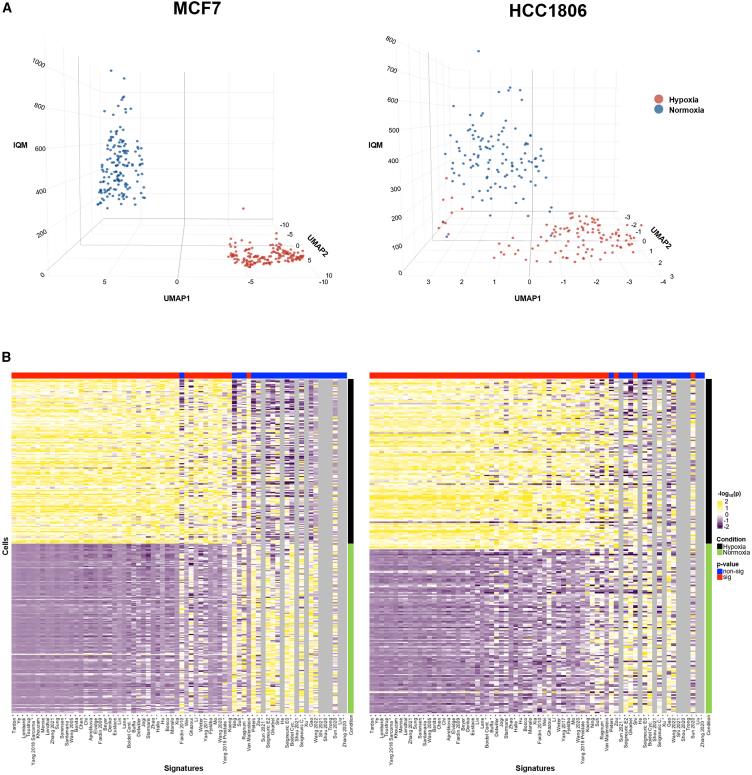
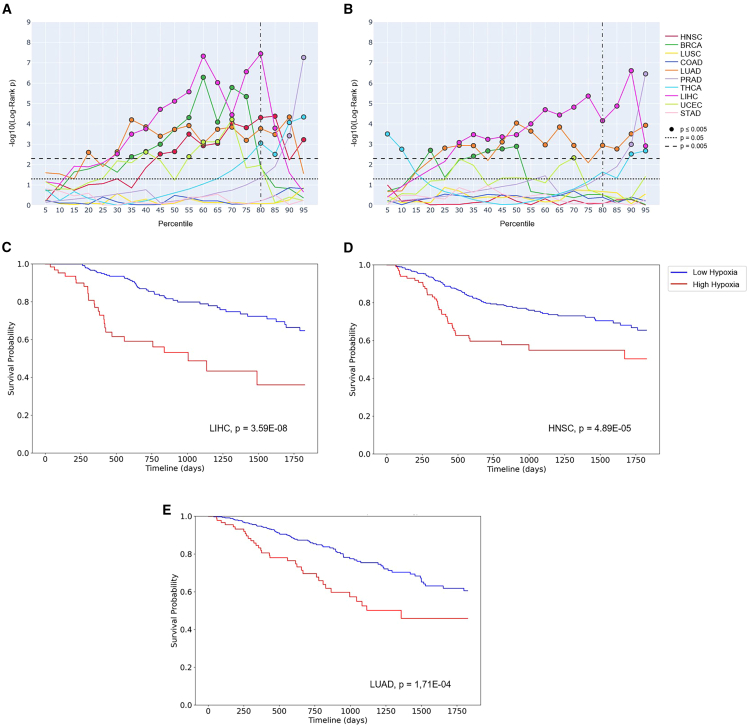
Tumor hypoxia drives metabolic shifts, cancer progression, and therapeutic resistance. Challenges in quantifying hypoxia have hindered the exploitation of this potential "Achilles' heel." While gene expression signatures have shown promise as surrogate measures of hypoxia, signature usage is heterogeneous and debated. Here, we present a systematic pan-cancer evaluation of 70 hypoxia signatures and 14 summary scores in 104 cell lines and 5,407 tumor samples using 472 million length-matched random gene signatures. Signature and score choice strongly influenced the prediction of hypoxia in vitro and in vivo. In cell lines, the Tardon signature was highly accurate in both bulk and single-cell data (94% accuracy, interquartile mean). In tumors, the Buffa and Ragnum signatures demonstrated superior performance, with Buffa/mean and Ragnum/interquartile mean emerging as the most promising for prospective clinical trials. This work delivers recommendations for experimental hypoxia detection and patient stratification for hypoxia-targeting therapies, alongside a generalizable framework for signature evaluation.

Keywords: biomarkers; gene signature; hypoxia; hypoxia-targeting therapies; patient stratification; radiotherapy; signature scores; single cell; transcriptomics; tumorigenesis.


Conflict of interest statement

Declaration of interests The authors declare no competing interests.

Figures

None
Graphical abstract
Figure 1
Figure 1
Identification of hypoxia gene expression signatures (A) The approach taken in the systematic review. 70 hypoxia signatures were discovered across the interrogated databases (PubMed, Scopus, and Web of Science). Most frequently occurring genes across the 70 signatures are reported in (B) and pathways enriched across all signatures are reported in (C).
Figure 2
Figure 2
The performance of the top-performing signature in cell-line datasets, the Toustrup signature A single published hypoxia experiment (GEO: GSE29406) is shown, alongside an analysis of the Toustrup signature performance across all publicly available hypoxia experiments with breast cancer cell lines. (A) The distribution of genes in three normoxic and three hypoxic replicates of MCF-7 cells. The expression of the genes within the Toustrup hypoxia signature is shown in red and a random gene signature of the same length is shown in green. Hypoxia was defined as cells being placed in 1% oxygen for 24 h. (B) Comparison of 14 scoring methods applied to the Toustrup hypoxia signature in GEO: GSE29406. The darker the shade of blue in the heatmap, the more accurate the score is at differentiating between hypoxic and non-hypoxic samples, compared to random gene signatures (RGSs) of the same length. Gray indicates that the score/signature combination did not significantly outperform RGS (p > 0.005). The two density plots below the heatmap show how the p value is calculated for median and mean absolute deviation (MAD) scores using the Euclidean distances from RGS as a null distribution. Within each plot, a bar highlighted by a red arrow marks the specific bin where the Euclidean distance corresponding to the original signature is located. Notably, the Euclidean distance obtained using the median score has a significantly higher value distinctly separating it from the null distribution. This is not the case with the MAD score, and this yields a non-significant result (gray in the heatmap). (C) Summary of the performance of the Toustrup signature using the different scoring methods across publicly available gene expression data from hypoxia experiments using breast cancer cell lines. The radar bar plot outlines the percentage accuracy achieved using the Toustrup signature and the different scoring methods. The larger and more beige the spoke, the more accurate the scoring method (radial axis: percentage accuracy at correctly determining hypoxic samples). The highest accuracy was achieved using IQM (98.3%), followed by trimean (98.0%) and the median score (97.5%).
Figure 3
Figure 3
Comparison of the performance of the 70 published hypoxia signatures using the IQM in 104 cancer cell lines Performance of the 70 hypoxia signatures across all hypoxia experiments identified in the GEO using the IQM. In the main body, the brighter the shade of red, the more accurate the signatures at differentiating between hypoxic and non-hypoxic samples compared to RGSs of the same length. The legend on the right-hand side shows several features for the samples analyzed (legend titles are reported at the start of the x axis). In addition, asterisk (∗) denotes signatures derived using cell lines, whereas “°” denotes signatures derived using clinical samples. At the summit of the figure, percentage accuracy is displayed (maximum accuracy: 94%, Tardon).
Figure 4
Figure 4
Performance of the Tardon signature using the IQM in scRNA-seq data for MCF7 and HCC1806 cells under normoxic and hypoxic conditions After reaching maximum accuracy in bulk RNA-seq, Tardon performs extremely well in the more sparse scRNA-seq data. This is shown in all three panels. (A) 3D uniform manifold approximation and projection (UMAP) representation with x and y axes displaying UMAP dimensions and z axis showing the IQM score of the Tardon signature for individual cells. Separation between normoxia and hypoxia is seen in both cell lines. (B) IQM scores across all tested signatures, annotated vertically by experimental condition and horizontally by significance level. The heatmap reveals high concordance between single-cell and bulk data. Gray vertical lines indicate instances where insufficient genes are available for IQM calculation, which requires a minimum of four values.
Figure 5
Figure 5
The Buffa signature emerges as a promising signature for clinical use Survival analysis was conducted to evaluate the prognostic value of Buffa/mean and Ragnum/IQM in 10 cancer types in TCGA. Iterative dichotomization of the cohorts into “high” and “low” hypoxia groups at every fifth percentile threshold aimed to pinpoint the optimal percentile for maximum prognostic effectiveness and suggest a potentially useful threshold for subsequent clinical testing. Line plots for the Buffa/mean (A) and Ragnum/IQM (B) show the changes in the log-rank p from the Kaplan-Meier survival analysis across different percentiles for the individual cancer types. The line at the 80th percentile corresponds to 20% of the cohort being in the “high” hypoxia group. Individual Kaplan-Meier plots are shown for this promising cut point using Buffa/mean for LIHC (C), HNSC (D), and LUAD (E).

Similar articles

Cited by

References

    1. Harris A.L. Hypoxia — a key regulatory factor in tumour growth. Nat. Rev. Cancer. 2002;2:38–47. - PubMed
    1. Petrova V., Annicchiarico-Petruzzelli M., Melino G., Amelio I. The hypoxic tumour microenvironment. Oncogenesis. 2018;7:10. - PMC - PubMed
    1. Brizel D.M., Dodge R.K., Clough R.W., Dewhirst M.W. Oxygenation of head and neck cancer: changes during radiotherapy and impact on treatment outcome. Radiother. Oncol. 1999;53:113–117. - PubMed
    1. Nordsmark M., Overgaard J. Tumor hypoxia is independent of hemoglobin and prognostic for loco-regional tumor control after primary radiotherapy in advanced head and neck cancer. Acta Oncol. 2004;43:396–403. - PubMed
    1. Luoto K.R., Kumareswaran R., Bristow R.G. Tumor hypoxia as a driving force in genetic instability. Genome Integr. 2013;4:5. - PMC - PubMed