. 2025 Feb 18;6(2):101933.
doi: 10.1016/j.xcrm.2025.101933. Epub 2025 Jan 31.

An integrative multiparametric approach stratifies putative distinct phenotypes of blast phase chronic myelomonocytic leukemia

Affiliations

An integrative multiparametric approach stratifies putative distinct phenotypes of blast phase chronic myelomonocytic leukemia

Kristian Gurashi et al. Cell Rep Med. .

Abstract

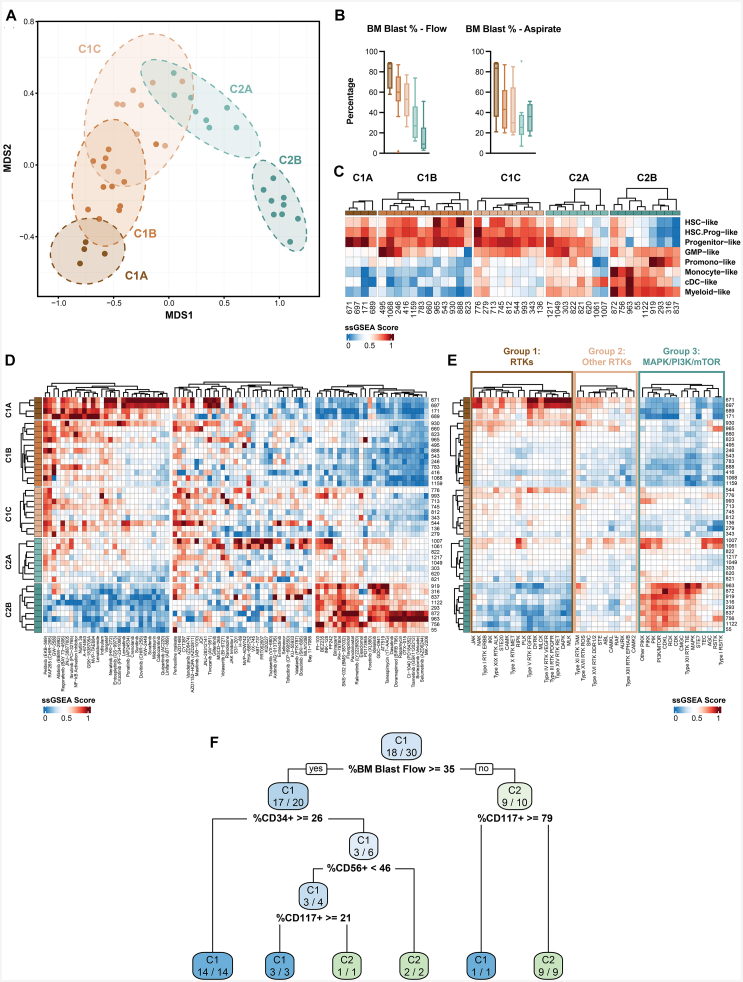
Approximately 30% of patients with chronic myelomonocytic leukemia (CMML) undergo transformation to a chemo-refractory blastic phase (BP-CMML). Seeking novel therapeutic approaches, we profiled blast transcriptomes from 42 BP-CMMLs, observing extensive transcriptional heterogeneity and poor alignment to current acute myeloid leukemia (AML) classifications. BP-CMMLs display distinctive transcriptomic profiles, including enrichment for quiescence and variability in drug response signatures. Integrating clinical, immunophenotype, and transcriptome parameters, Random Forest unsupervised clustering distinguishes immature and mature subtypes characterized by differential expression of transcriptional modules, oncogenes, apoptotic regulators, and patterns of surface marker expression. Subtypes differ in predicted response to AML drugs, validated ex vivo in primary samples. Iteratively refined stratification resolves a classification structure comprising five subtypes along a maturation spectrum, predictive of response to novel agents including consistent patterns for receptor tyrosine kinase (RTK), cyclin-dependent kinase (CDK), mechanistic target of rapamycin (MTOR), and mitogen-activated protein kinase (MAPK) inhibitors. Finally, we generate a prototype decision tree to stratify BP-CMML with high specificity and sensitivity, requiring validation but with potential clinical applicability to guide personalized drug selection for improved outcomes.

Keywords: CMML; MDS/MPN; blast phase; leukemic transformation; secondary AML.


Conflict of interest statement

Declaration of interests The authors declare no competing interests.

Figures

None
Graphical abstract
Figure 1
Figure 1
Blast phase CMML displays distinctive clinical and molecular characteristics that differentiate it from other forms of AML (A) Oncoprint showing mutation status and other key metadata for the discovery cohort of patients with BP-CMML from The Christie NHS Foundation Trust (Manchester, UK). Individual patients are represented in columns, genes in rows, and black squares denote mutated status. Rows are clustered by hierarchical clustering, ordering genes by most to least mutated, as described by bar plots on the right that reports frequencies of mutations. Absolute number of mutations reported in each patient is reported on the bar plot underneath the main figure. Additional disease state information is provided in the upper rows as indicated. (B) Bar graphs represent the relative mutation frequencies for the combined Christie-NTUH BP-CMML cohort (left), as compared with two de novo AML cohorts (TCGA and BeatAML cohorts, respectively). Mutation frequencies were compared, and significance was determined by chi-squared test; significance is reported by either stars (grouped distributions) or square/dots (individual distributions; only performed between the TCGA and BP-CMML cohorts). (C) Kaplan-Meier (KM) curves comparing overall survival for the three cohorts (as described in B). p values determined by the Log rank test. (D) KM curves comparing overall survival for the BP-CMML cohort against Christie-NTUH cohorts of blast-transformed sAML from prior MDS and MPN. p values determined by the Log rank test. (E) Bar graphs displaying mutation frequencies comparing the discovery BP-CMML cohort with the other sAML cohorts (BP-MDS and BP-MPN cohorts, respectively). p values determined by chi-squared test.
Figure 2
Figure 2
BP-CMML blasts are transcriptionally heterogeneous and characterized by increased quiescence and senescence signatures (A) Schematic showcasing experimental design for the BP-CMML transcriptome analyses. Created via BioRender. (B) Exemplar sort strategy used to isolate blast cells, highlighting (from left to right) selection of live cells on forward scatter area (FSC-A) vs. SSC-A, doublet removal, live cell enrichment, and selection of cells lying within the “blast gate” (CD45wkSSClow; fourth from the left). (C) PCA plot showing samples’ coordinates for top three principal components ranked by variance explained and identified by PCA analysis of variance stabilizing transformation (VST) normalized count data. Samples are colored by disease state/ICC classification as indicated. (D) Volcano plot of differentially expressed genes comparing BP-CMML to healthy age-matched control HSPCs. Total number of up- and downregulated DEGs identified at p adj. < 0.05 is annotated. Indendent Hypothesis Weighting corrected p values determined via DESeq2 Wald test. (E) Heatmap showing the top 30 up- and downregulated DEGs per condition, ranked by p adj. value. Rows indicate samples; columns indicate genes. Reported expressions are scaled VST normalized count. (F) Violin plot of gene dispersions in control vs. BP-CMMLs highlighting increased inter-patient transcriptional heterogeneity in the latter. p value (<0.0001) was derived using Mann-Whitney test. (G) Selected significant (false discovery rate [FDR] < 0.05) and biologically meaningful results from fGSEA pathway analysis performed on hallmark, canonical and gene ontology pathways sets. FDR values represent Benjamini-Hochberg P values determined by fGSEA using a multilevel splitting Monte Carlo approach. (H) Gene set enrichment analysis (GSEA) plots from fGSEA pathway analysis results for curated cell cycle and related pathways. FDR and normalized enrichment scores (NES) are annotated for each analysis.
Figure 3
Figure 3
Identification of novel gene modules associated with BP-CMML blast populations (A) Topological overlap matrix (TOM) built with WGCNA using top 7,000 variable genes as applied to our BP-CMML RNA-seq cohort. Hierarchical clustering of the matrix identified six gene modules (ME), as indicated. (B) Gene to trait correlation plot for the six WGCNA modules identified. Upper dendrogram displays gene association to the assigned module; lower part displays the correlation of each gene to disease state. (C) Modules to trait correlation heatmap reporting strength (Pearson) and significance (Student’s t test) of module correlation to disease subtype and mutations. (D–F) Functional annotation of the indicated WGCNA modules. Each plot displays on the left the top regulator genes ranked by the mean TF-target weights (x axis), and on the right representative −log10 p value ranked pathways for the top 30% genes associated with each module. (G) Ridge plots of scaled single-sample GSEA (ssGSEA) pathway enrichment scores, scoring samples for the top of 30% genes associated to each module. Plots highlight differential distributions of the computed modules across samples, revealing heterogeneous profiles in BP-CMML cases.
Figure 4
Figure 4
Random Forest multiparametric data integration identifies two core BP-CMML subtypes distinguished by blast maturation status (A) Heatmap (with cell surface markers as rows; patients as columns) of scaled geometric mean fluorescence intensity (MFI) for 10 protein and 1 morphology marker (SSC-A). MFIs were derived for each patient’s sample from cells falling within the blast gate. (B) Schematic representing the workflow of multi-parametric integration for the RF classifier. Created via BioRender. (C) Bar chart and boxplot showing the respective number of features inputted into the Random Forest (RF) model (left), and the assigned importance for each variable within each feature class (right). The number of variables for the feature classes transcriptome, immunophenotype, and clinical class is n = 46, n = 11, and n = 120, respectively. Boxplot are drawn from the first to third quantile applying the Tukey range method. The plots reveal discordance between the number of features applied and their relative weighting in the model. (D) Hierarchical clustering and multidimensional scaling of samples’ similarity matrix from the RF model, which deconvolutes sample heterogeneity revealing first-order stratification into two main groups, C1 and C2, as indicated. (E) Boxplots (Tukey range) comparing C1 and C2 subgroups by relative percentage of blasts observed by flow cytometry (upper) and BM aspirate smear morphology (lower). p values determined via Mann-Whitney test are respectively <0.0001 and n.s. (F) Boxplots (Tukey range) comparing C1 and C2 subgroups by flow cytometry blast MFI (y axis) for the indicated immunophenotypic surface and morphological markers. p values determined via Mann-Whitney test are as follows: CD34 (p = 0.0116), CD117 (p = 0.0004), SSC-A (p = 0.0028), CD123 (p = 0.0283) and CD56 (p < 0.0001). (G) Bar graph comparing relative frequencies for selected recurrent mutations between the C1 and C2 BP-CMML subtypes. (H) Kaplan-Meier (KM) curves comparing overall survival for the C1 and C2 BP-CMML subtypes. p values determined by the Log rank test.
Figure 5
Figure 5
Transcriptional differences between BP-CMML subtypes reveal distinct biological drivers (A) Heatmap showing scaled (ssGSEA) enrichments for published gene signatures associated with different phenotypes of AML maturation status. Significant differences in enrichment for samples in C1 and C2 are highlighted by either a star or dot depending on significance level (as indicated). p values determined via Mann-Whitney test. (B) Heatmap showing scaled (ssGSEA) enrichments for the computed WGCNA ME modules for samples in C1 and C2 (see Figure 3). (C) Volcano plots showing differentially expressed genes for C1 (left) and C2 (right) samples, as compared versus healthy age-matched control HSPC transcriptomes. Total number of up- and down-regulated DEGs identified at p adj. < 0.05 (IHW corrected p values computed via DESeq2 Wald test) is reported above each plot. (D) Intersections of genes upregulated in C1 and C2 subtypes versus controls. Selected overexpressed surface CD markers (purple) and transcription factor genes (red) are highlighted for each comparison. (E) Boxplots (Tukey range) comparing normalized expression (VST) of the indicated surface immune checkpoint protein markers between healthy control HSPCs (gray), C1 immature (brown), and C2 mature (green) BP-CMML subtypes. p values determined by Mann-Whitney test are as follows: CD276 (p = 0.04) and CD70 (p = 0.02). (F) Boxplots (Tukey range) comparing normalized gene expression (lower) and matched validated protein expression (upper) for the indicated surface markers between C1 immature (brown) and C2 mature (green) BP-CMML subtypes. p values determined by Mann-Whitney test are as follows: CD99 (protein p = 0.0769; RNA p = 0.0001), CD82 (protein p = 0.01; RNA p < 0.0001) and CD53 (protein p < 0.0001; RNA p = 0.0016) (G) Heatmap showing top 30 up- and downregulated DEGs for each BP-CMML subtype, as ranked by p adj. value. Rows indicate samples separated by subtype and conditions: HSPCs (gray), C1 immature (brown), and C2 mature (green) BP-CMML subtypes; columns denote genes. The heatmap demonstrates how the RF clustering outperforms hierarchical clustering based on transcriptome alone, bringing structure to the otherwise heterogeneous BP-CMML cohort. (H) Selected significant (FDR < 0.05) and biological meaningful results from fGSEA pathway analysis performed on hallmark, canonical, and gene ontology pathways sets comparing C1 (immature) and C2 (mature) BP-CMML subtypes. FDR values are Benjamini-Hochberg p values determined by fGSEA using a multilevel splitting Monte Carlo approach. (I) GSEA plots from fGSEA pathway analysis results for curated cell cycle and related pathways. FDR and normalized enrichment scores (NES) are annotated for each analysis.
Figure 6
Figure 6
BP-CMML subtypes display differential sensitivity toward commonly used AML drugs (A) Boxplots (Tukey range) comparing scaled (ssGSEA) enrichment scores for mined signatures of response/resistance to the indicated drugs (from the referenced studies) between healthy control HSPCs (gray), C1 immature (brown), and C2 mature (green) BP-CMML subtypes. p values determined via Mann-Whitney are as follows: azacitidine (p = 0.001), venetoclax (p < 0.0001), daunorubicin (p = 0.016) and cytarabine (p < 0.0001). (B) Dose-response curves for BP-CMML BM MNCs treated ex vivo with azacitidine, venetoclax, daunorubicin, and cytarabine, illustrating differential response of C1 (n = 4 biological replicates) and C2 subtypes (n = 3) to these compounds. Values are means from grouped biological replicates and related technical triplicates (n = 3). Error bars indicated standard deviation (SD) from the means. p values determined via Mann-Whitney comparing drugs at different dosage are as follows: azacitidine (10 μM: < 0.0001), venetoclax (10 nM: 0.01, 100 nM: 0.004, 1 μM: < 0.0001, 10 μM: < 0.0001), cytarabine (10 nM: 0.03, 100 nM: < 0.0001, 1 μM: < 0,0001, 10 μM < 0.0001) and daunorubicin (10 nM: 0.04, 100 nM: < 0.0001, 1 μM: 0.0002, 10 μM: 0.004). (C) Dose-response curves for BP-CMML BM MNCs treated ex vivo with different combinations and concentrations of azacitidine and venetoclax, illustrating similar marginal treatment improvement in C1 (n = 4 biological replicates) and C2 subtypes (n = 2). Values are means from grouped biological replicates and related technical triplicates (n = 3). Error bars indicate SD from the means. p values determined via Mann-Whitney are as follows: Ven+Aza combo dosage comparison in Immature (Ven dosage 1 nM: 0.01, 10 nM: 0.0001, 100 nM: 0.008), comparison in Mature (1 nM: 0.03, 1 μM: 0.004, 10 μM: 0.02), comparison across subgroups (1 μM: 0.0001, 10 μM: 0.001). (D) Pearson correlations of enrichment for signatures of response/resistance for each of the WGCNA ME modules. Significant (Student's t test) correlations are highlighted by star or dots depending on significance level, as indicated. (E) Correlation plots showing the strong linear relationship between expression of the indicated WGCNA ME module/s with venetoclax resistance (left) and cytarabine response (right). Each sample in the sequenced test cohort is indicated by a separate color-coded data point: healthy control HSPCs (gray), C1 immature (brown), and C2 mature (green) BP-CMML subtypes. Plots highlight how samples with respectively high and low expression for the myeloid differentiation module ME5 and the HSPC signature module ME3 display increasing resistance to both venetoclax and cytarabine. R and p values determined via sm_StatCorr function. (F) Contribution of somatic mutations to patterns of resistance in patients with C1 immature (left) and C2 mature (right) BP-CMML. Plots identify mutations in each cohort that significantly correlate with increased or decreased enrichment for signatures of resistance/response to the indicated drugs. p values determined via student's t test.
Figure 7
Figure 7
BP-CMML subtypes display different sensitivity profiles to other FDA and non-approved small molecules, with responses mirroring respective maturation status (A) Multidimensional scaling plot highlighting second-order separation for BP-CMML samples, on k = 5 subtypes, further stratifying the C1 and C2 transformation subtypes in C1A (n = 4), C1B (n = 12), and C1C (n = 9), and C2A (n = 8) and C2B (n = 9), respectively. This partially resolved the remaining heterogeneity of drug sensitivity patterns in the original dichotomous separation. (B) Boxplots (Tukey range) comparing the relative percentage of blasts observed by flow cytometry (left) and BM aspirate smear morphology (right) across the five defined BP-CMML subgroups. The plot highlights a progressive decrease in proportion of blasts from C1A to C2B. (C) Heatmap showing scaled (ssGSEA) enrichments for published gene signatures associated with different phenotypes of AML maturation status across the five defined BP-CMML subgroups. The plot highlights a gradual reduction from C1A to C2B in enrichment for HSC/progenitor-like signatures, opposed by an increase in enrichment for myeloid-like signatures. (D and E) Heatmaps showing scaled (ssGSEA) enrichment scores for signatures of response against various drug compounds (n = 87; D), hierarchically clustered and grouped by response patterns for the indicated drug families (E). (F) High accuracy (91.67%) decision tree model built on regressed clinical and immunophenotypic features, as a putative tool for distinguishing immature (C1) and mature (C2) BP-CMML transformations in the clinic.

References

    1. Khoury J.D., Solary E., Abla O., Akkari Y., Alaggio R., Apperley J.F., Bejar R., Berti E., Busque L., Chan J.K.C., et al. The 5th edition of the World Health Organization Classification of Haematolymphoid Tumours: Myeloid and Histiocytic/Dendritic Neoplasms. Leukemia. 2022;36:1703–1719. - PMC - PubMed
    1. Mason C.C., Khorashad J.S., Tantravahi S.K., Kelley T.W., Zabriskie M.S., Yan D., Pomicter A.D., Reynolds K.R., Eiring A.M., Kronenberg Z., et al. Age-related mutations and chronic myelomonocytic leukemia. Leukemia. 2016;30:906–913. - PMC - PubMed
    1. Solary E., Itzykson R. How I treat chronic myelomonocytic leukemia. Blood. 2017;130:126–136. - PubMed
    1. Valent P., Orazi A., Savona M.R., Patnaik M.M., Onida F., van de Loosdrecht A.A., Haase D., Haferlach T., Elena C., Pleyer L., et al. Proposed diagnostic criteria for classical chronic myelomonocytic leukemia (CMML), CMML variants and pre-CMML conditions. Haematologica. 2019;104:1935–1949. - PMC - PubMed
    1. Batta K., Bossenbroek H.M., Pemmaraju N., Wilks D.P., Chasty R., Dennis M., Milne P., Collin M., Beird H.C., Taylor J., et al. Divergent clonal evolution of blastic plasmacytoid dendritic cell neoplasm and chronic myelomonocytic leukemia from a shared TET2-mutated origin. Leukemia. 2021;35:3299–3303. - PMC - PubMed