. 2025 Aug 1;98(3):260-270.
doi: 10.1016/j.biopsych.2024.12.022. Epub 2025 Jan 30.

Interneuron Loss and Microglia Activation by Transcriptome Analyses in the Basal Ganglia of Tourette Disorder

Affiliations

Interneuron Loss and Microglia Activation by Transcriptome Analyses in the Basal Ganglia of Tourette Disorder

Yifan Wang et al. Biol Psychiatry. .

Abstract

Background: Tourette disorder (TS) is characterized by motor hyperactivity and tics that are believed to originate in the basal ganglia. Postmortem immunocytochemical analyses has revealed decreases in cholinergic (CH), as well as parvalbumin and somatostatin GABA (gamma-aminobutyric acid) interneurons (INs) within the caudate/putamen of individuals with TS.

Methods: We obtained transcriptome and open chromatin datasets by single-nucleus RNA sequencing and single-nucleus ATAC sequencing, respectively, from caudate/putamen postmortem specimens of 6 adults with TS and 6 matched normal control subjects. Differential gene expression and differential chromatin accessibility analyses were performed in identified cell types.

Results: The data reproduced the known cellular composition of the human striatum, including a majority of medium spiny neurons (MSNs) and small populations of GABA-INs and CH-INs. INs were decreased by ∼50% in TS brains, with no difference in other cell types. Differential gene expression analysis suggested that mitochondrial oxidative metabolism in MSNs and synaptic adhesion and function in INs were both decreased in subjects with TS, while there was activation of immune response in microglia. Gene expression changes correlated with changes in activity of cis-regulatory elements, suggesting a relationship of transcriptomic and regulatory abnormalities in MSNs, oligodendrocytes, and astrocytes of TS brains.

Conclusions: This initial analysis of the TS basal ganglia transcriptome at the single-cell level confirms the loss and synaptic dysfunction of basal ganglia INs, consistent with in vivo basal ganglia hyperactivity. In parallel, oxidative metabolism was decreased in MSNs and correlated with activation of microglia cells, which is attributable at least in part to dysregulated activity of putative enhancers, implicating altered epigenomic regulation in TS.

Keywords: Human; Interneurons; Microglia; Multiomics; Striatum; Tourette disorder.


Conflict of interest statement

Disclosure

The authors declare no competing interest.

Figures

Figure 1.
Figure 1.. Clustering cells based on snRNA-seq and snATAC-seq data and defining cell types.
A) Outline of basal ganglia (BG) anatomy in a coronal human brain section. B) Wiring diagram of BG circuitry. C) UMAP clustering of nuclei from 12 brains based on snRNA-seq data. Clusters (see Figure S1) are grouped into six cell types. D) UMAP plots colored by marker expression across cell types. Markers in order: DRD1 (for MSN1), DRD2 (for MSN2), OLIG1 (for OL), a combination of IN markers, AQP4 (for AST), CD74 (for MG). E) snRNA marker expression across cell types. Color of dots represents average expression; size represents percent of nuclei expressing a gene. F) UMAP clustering of nuclei from 12 brains based on snATAC-seq data. Clusters of cell types are annotated based on label transfer from snRNA-seq clusters. G) UMAPs from ATAC-seq data colored by normalized count of ATAC-seq reads within genes for different cell types. Markers in order: DRD1 (for MSN1), DRD2 (for MSN2), OLIG1 (for OL), DLX1 (for IN), GFAP (for AST), RGS10 (for MG). H) Normalized counts of snATAC reads within gene markers in cell types. Color of dots represent average counts; size represent percent of nuclei expressing the gene. Details for all genetic markers are in Table S6.
Figure 2.
Figure 2.. Transcriptomic profiles of TS brains compared to NC.
A) Normalized difference in cell type proportions comparing TS to NC brains assessed using snRNA-seq data. **p-value < 0.001 by paired t-test. B) Number of differentially expressed genes in each cell types comparing TS to NC brains. C) GO terms enrichment for differentially expressed genes (up- and down-regulated) in TS vs NC brains. y-axis: enriched GO terms with immune system related terms in red; adhesion, channels and synaptic related terms in blue; and mitochondria related terms in green. x-axis: cell types. Circle size: number of genes in the enriched GO term, circle color: −log10(FDR) for the enrichment. GO terms were ordered based on the p-value in each cell type. D) Correlation across 5 pairs of brains (red dots) between functional scores in mitochondrial GO terms in MSN (x-axis) and in immune response-related GO terms in MG (y-axis). R = 0.927; p-value = 0.023.
Figure 3.
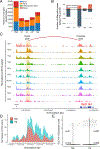
Figure 3.. Chromatin accessibility profiles of Tourette disorder brains compared to normal controls.
Number of snATAC-seq peaks across genome annotations. Y-axis: number of peaks; x-axis: cell types. B) Number of differentially accessible peaks (DAP) in TS as compared to NC brains. Y-axis: number of peaks; x-axis: cell types. C) Up-regulation of the SLC11A1 transcript in MG correlates positively with a more accessible distal DAP in TS brains. x-axis: genome coordinates; y-axis: aggregated normalized snATAC-seq signal in MGs of each brain; orange areas: snATAC-seq distal peaks co-accessible with snATAC-seq peaks proximal to the SLC11A1 promoter; red arches: predicted co-accessible peak pairs. D) More accessible snATAC-seq distal peaks combined in all TS vs all NC brains which are co-accessible with SLC11A1 promoter (adjusted p-value < 0.001, log2(FC) = 0.502); x-axis: chromosome position; y-axis: normalized snATAC-seq signal. E) Higher expression of SLC11A1 in nuclei from TS brains as compared to NC brains (adjusted p-value < 0.001, log2(FC) = 2.56). x-axis: expression level of SLC11A1; y-axis: density of number of nuclei.

Update of

References

    1. Leckman JF (2002): Tourette’s syndrome. Lancet. 360:1577–1586. - PubMed
    1. Leckman JF, Peterson BS (1993): The pathogenesis of Tourette’s syndrome: epigenetic factors active in early CNS development. Biol Psychiatry. 34:425–427. - PubMed
    1. Davis LK, Yu D, Keenan CL, Gamazon ER, Konkashbaev AI, Derks EM, et al. (2013): Partitioning the heritability of Tourette syndrome and obsessive compulsive disorder reveals differences in genetic architecture. PLoS Genet. 9:e1003864. - PMC - PubMed
    1. Tsetsos F, Topaloudi A, Jain P, Yang Z, Yu D, Kolovos P, et al. (2023): Genome-wide Association Study Points to Novel Locus for Gilles de la Tourette Syndrome. Biol Psychiatry. - PMC - PubMed
    1. Scharf JM, Yu D, Mathews CA, Neale BM, Stewart SE, Fagerness JA, et al. (2013): Genome-wide association study of Tourette’s syndrome. Mol Psychiatry. 18:721–728. - PMC - PubMed