. 2025 Mar 31:613:217495.
doi: 10.1016/j.canlet.2025.217495. Epub 2025 Jan 30.

ATRX mutations mediate an immunogenic phenotype and macrophage infiltration in neuroblastoma

Affiliations

ATRX mutations mediate an immunogenic phenotype and macrophage infiltration in neuroblastoma

Federica Lorenzi et al. Cancer Lett. .

Abstract

ATRX is one of the most frequently mutated genes in high-risk neuroblastoma. ATRX mutations are mutually exclusive with MYCN amplification and mark a recognizable patient subgroup, presenting in older children with chemotherapy-resistant, slowly progressive disease. The mechanisms underlying how ATRX mutations drive high-risk and difficult-to-treat neuroblastoma are still largely elusive. To unravel the role of ATRX in neuroblastoma, we generated isogenic neuroblastoma cell line models with ATRX loss-of-function and ATRX in-frame multi-exon deletions, representing different types of alterations found in patients. RNA-sequencing analysis consistently showed significant upregulation of inflammatory response pathways in the ATRX-altered cell lines. In vivo, ATRX alterations are consistently associated with macrophage infiltration across multiple xenograft models. Furthermore, ATRX alterations also result in upregulation of epithelial-to-mesenchymal transition pathways and a reduction in expression of adrenergic core-regulatory circuit genes. Consistent with this, bioinformatic analysis of previously published neuroblastoma patient data sets revealed that ATRX-altered neuroblastomas display an immunogenic phenotype and higher score of macrophages (with no distinction between M1 and M2 macrophage populations) and dendritic cells, but not lymphocytes. Histopathological assessment of diagnostic samples from patients with ATRX mutant disease confirmed these findings with significantly more macrophage infiltration compared to MYCN-amplified tumors. In conclusion, we show that gene expression and cell-state changes as a result of ATRX alterations associate with a characteristic immune cell infiltration in both in vivo models and patient samples. Together, this provides novel insight into mechanisms underlying the distinct clinical phenotype seen in this group of patients.

Keywords: ATRX; Macrophages; Neuroblastoma; Tumour microenvironment.


Conflict of interest statement

Declaration of competing interest The authors declare that they have no known competing financial interests or personal relationships that could have appeared to influence the work reported in this paper.

Figures

Fig. 1.
Fig. 1.
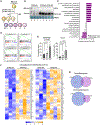
Knockout of ATRX induces ALT in NBL-S cell lines. A, Schematic of generation of TP53 knockout (KO) (A, B, C) and TP53;ATRX KO (KO-1 to KO-7) NBL-S cell lines by CRISPR-Cas9 technology. B, Western blot analysis of expression levels of ATRX and TP53 in NBL-S mutant lines. C, Immunoblots of wildtype (WT), KO-1 and KO-2 NBL-S cells following 10 Gy irradiation and/or exogenous expression of TP53 using ATRX, TP53, total PARP, cleaved PARP, p21 and γH2AX antibodies. GAPDH was used as loading control. D, Representative dot blot of DNA c-circles amplified by ϕ29 DNA polymerase (alongside no ϕ29 DNA polymerase control) of NBL-S WT and ATRX KO cell lines. DNA from the ALT-positive CHLA-90 cell line was used as positive control. E, Quantification of dot blots (n = 4 biological replicates). Graph reports individual intensity data points relative to corresponding no ϕ29 DNA polymerase control per each cell line. P values, calculated using one-way ANOVA, show the comparison of KO-1 with NBL-S WT and KO-7 with the parental cell line A (*P < 0.05, ***P < 0.001). F, Histogram shows relative telomere length by quantitative PCR of NBL-S cell lines. VAV2 was used as the single copy gene to normalize telomere PCR product. The experiment was done in triplicate and in three independent occasions. Data are shown as mean ± SEM, ***P < 0.001. P values, calculated using one-way ANOVA, show the comparison of KO-6 and KO-7 with the parental cell line A.
Fig. 2.
Fig. 2.
Knockout of ATRX associates with upregulation of inflammatory response pathways in NBL-S lines. A, List of top ten upregulated and downregulated terms based on annotated deregulated genes and (B) enrichment plots of top inflammation-related pathways (pre-ranked) by Gene Set Enrichment Analysis (GSEA) of ATRX KO NBL-S cell lines (KO-1, KO-2, KO-6, KO-7) compared to ATRX WT lines (NBL-S, A, C). C, Dot blots of human cytokine array of ATRX WT and ATRX KO-1, KO-6 and KO-7 cell line supernatants. D, Quantification of chemiluminescent intensity of SERPINE1 and CCL2 normalized to the mean density of the reference dots. One-way ANOVA was used to measure the statistical significance between A and KO-1, KO-2 or KO-7, separately (*P < 0.05, **P < 0.01, ***P < 0.001). E, Violin plots of the expression of SERPINE1 and CCL2 in NBL-S ATRX WT (NBL-S, A, B, C) or KO lines (all 7 KO lines: KO-1 – KO-7) measured by qRT-PCR (normalized to GAPDH expression). The experiment was done in triplicate and in three independent occasions. P values were measured with unpaired Student t-test.
Fig. 3.
Fig. 3.
ATRX mutations mediate macrophage infiltration in xenograft and PDX models. A, Kaplan-Meier analysis of mice bearing subcutaneous xenografts of ATRX mutant (KO-1, KO-2, KO-6, KO-7) or wildtype (NBL-S, A and C) NBL-S cells. P value calculated with log-rank (Mantel-Cox) test. B, Hematoxylin and eosin (H&E) staining and immunohistochemistry analysis for Ki-67, F4/80 and PHOX2B, in two representative ATRX WT (A, C) and KO (KO-2, KO-6) xenograft tissues. Scale bars, 100 μm. C, Histogram shows quantification of F4/80 (mouse macrophage marker) intensity in ATRX WT versus ATRX KO slides (n = 6, mean ± SEM, t-test). D, Adrenergic (ADRN) or mesenchymal (MES) gene signature scores and their correlation in ATRX WT (NBL-S, A and C) versus ATRX KO (KO-1, KO-2, KO-6, KO-7) NBL-S lines by RNA-seq analysis (t-test was used for left and middle panel, **P < 0.01). Right panel, Pearson r correlation. E, Representative images of immunohistochemistry analysis of adrenal medullas of Atrx wildtype (Atrx+/+) and knockout (Atrx/) mice using antibodies against Cre recombinase and ATRX (nuclear staining). Scale bars, 50 μm. F, Kaplan-Meier curve of Th-driven Atrx/ mice (n = 20) and Atrx+/+ mice (n = 30) in the C57BL/6 background (P value not significant, log-rank (Mantel-Cox) test). G, Kaplan-Meier curve of Th-driven Atrx/ mice (n = 37) and Atrx+/+ mice (n = 38) in the 129X1/SvJ background (P value not significant, log-rank (Mantel-Cox) test). H, Representative images of H&E staining and immunohistochemistry analysis of F4/80 of ATRX mutant PDXs or MYCN-amplified PDXs as control. Scale bars, 100 μm. I, Histogram reports the quantification of F4/80 positive staining of ATRX mutant PDXs and the ATRX IFF AMC772 patient-derived tumoroid xenograft compared to MYCN-amplified PDXs (mean ± SEM, t-test, **P < 0.01).
Fig. 4.
Fig. 4.
ATRX IFF alterations are also associated with an inflammatory phenotype in neuroblastoma. A, Schematic of generation of ATRX WT (D, E, F lines in yellow gradients, when IFF editing failed) and ATRX [–11] IFF (IFF-1 to IFF-5 lines in purple gradients) isogenic models using NBL-S A cells by CRISPR-Cas9. B, Western blot analysis of ATRX in NBL-S lines. Long exposure image shows bands of full-length ATRX in D, E and F cell lines but not in IFF-1, IFF-2, IFF-3, IFF-4 and IFF-5 ATRX mutant lines (*saturated bands). C, Top ten upregulated and downregulated terms based on annotated deregulated genes and (D) enrichment plots of top inflammation-related pathways by GSEA of ATRX IFF (IFF-2, IFF-3, IFF-4, IFF-5) vs WT (A, D, E) NBL-S cell lines. E, Histograms show SERPINE1 and CCL2 levels in cell culture supernatant of ATRX IFF (IFF-1, IFF-2 and IFF-4) or KO (KO-5, KO-7) NBL-S cell lines compared to ATRX WT lines (A, B, D and E) (mean ± SEM, P values by one-way ANOVA). F, Heat maps showing normalized counts of the top 50 upregulated genes in the inflammatory response gene set calculated by GSEA in ATRX KO (KO-1, KO-2, KO-6, KO-7) vs WT (NBL-S, A, C) (left) or ATRX IFF (IFF-2, IFF-3, IFF-4, IFF-5) vs WT (A, D, E) (right) NBL-S cell lines. G, Venn diagrams of the intersection of upregulated (top) or downregulated (bottom) genes between ATRX KO (KO-1, KO-2, KO-6, KO-7) and ATRX IFF (IFF-2, IFF-3, IFF-4, IFF-5) cell lines (FDR <5 % and absolute log2foldchange ≥ 0.75).
Fig. 5.
Fig. 5.
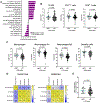
ATRX mutations mediate an immunogenic phenotype in neuroblastoma patient RNA sequencing datasets. A, Top 10 upregulated and downregulated terms of GSEA of ATRX mutant samples in Tumor Neuroblastoma ALT - Westermann −144 - tpm - gencode19 dataset. B-C, Plots show lymphoid or myeloid cell type-specific scores of neuroblastoma patient samples in the Westermann dataset based on the ATRX status, using the xCell tool. P values were calculated with Mann-Whitney test. D, Heatmaps indicate the correlation between the expression of ATRX and macrophage, macrophage M1 or macrophage M2 scores in TARGET and GSE62564 high-risk neuroblastoma patient datasets (Spearman correlation). E, Mean expression of genes that define the immunogenic cluster of neuroblastoma in ATRX mutant versus wildtype samples in the Westermann dataset (P value calculated with Mann-Whitney test).
Fig. 6.
Fig. 6.
Increased immune infiltration is observed in ATRX IFF neuroblastoma compared with MYCN-amplified disease. A, B, C, Histograms show the comparison of CD3, CD20 or CD68 positive cells between MYCN-amplified (MNA), non-MNA and ATRX IFF patient samples by histopathological analysis. Data are shown as mean ± SEM (one-way ANOVA, *P < 0.05). D, Representative images of H&E and immunohistochemical studies of ATRX mutant patients compared to MYCN-amplified and non MYCN-amplified patients examining dispersed T (CD3) and B (CD20) lymphocytes and macrophages (CD68). Scale bars (black), 20 μm. E, Histogram reports number of CD14 and CD163 positive cells in ATRX mutant patient samples. Each patient sample is color-coded. F, Representative images of immunohistochemistry analysis of CD14 or CD163-positive macrophages in ATRX mutant patients. Scale bars (black), 20 μm.

References

    1. Aguilera P, López-Contreras AJ, ATRX, a guardian of chromatin, Trends Genet. 39 (6) (2023) 505–519. - PubMed
    1. Jansky S, Sharma AK, Körber V, Quintero A, Toprak UH, Wecht EM, et al., Single-cell transcriptomic analyses provide insights into the developmental origins of neuroblastoma, Nat. Genet 53 (5) (2021) 683–693. - PubMed
    1. Qiu B, Matthay KK, Advancing therapy for neuroblastoma, Nat. Rev. Clin. Oncol 19 (8) (2022) 515–533. - PubMed
    1. Zeineldin M, Federico S, Chen X, Fan Y, Xu B, Stewart E, et al., MYCN amplification and ATRX mutations are incompatible in neuroblastoma, Nat. Commun 11 (1) (2020) 913. - PMC - PubMed
    1. Morgenstern DA, Pötschger U, Moreno L, Papadakis V, Owens C, Ash S, et al., Risk stratification of high-risk metastatic neuroblastoma: a report from the HRNBL-1/SIOPEN study, Pediatr. Blood Cancer 65 (11) (2018) e27363. - PubMed

Substances