. 2025;19(5):101472.
doi: 10.1016/j.jcmgh.2025.101472. Epub 2025 Jan 30.

Cellular Crosstalk Promotes Hepatic Progenitor Cell Proliferation and Stellate Cell Activation in 3D Co-culture

Affiliations

Cellular Crosstalk Promotes Hepatic Progenitor Cell Proliferation and Stellate Cell Activation in 3D Co-culture

Maya W Haaker et al. Cell Mol Gastroenterol Hepatol. 2025.

Abstract

Background & aims: Following liver damage, ductular reaction often coincides with liver fibrosis. Proliferation of hepatic progenitor cells is observed in ductular reaction, whereas activated hepatic stellate cells (HSCs) are the main drivers of liver fibrosis. These observations may suggest a functional interaction between these 2 cell types. Here, we report on an in vitro co-culture system to examine these interactions and validate their co-expression in human liver explants.

Methods: In a 3D organoid co-culture system, we combined freshly isolated quiescent mouse HSCs and fluorescently labeled progenitor cells (undifferentiated intrahepatic cholangiocyte organoids), permitting real-time observation of cell morphology and behavior. After 7 days, cells were sorted based on the fluorescent label and analyzed for changes in gene expression.

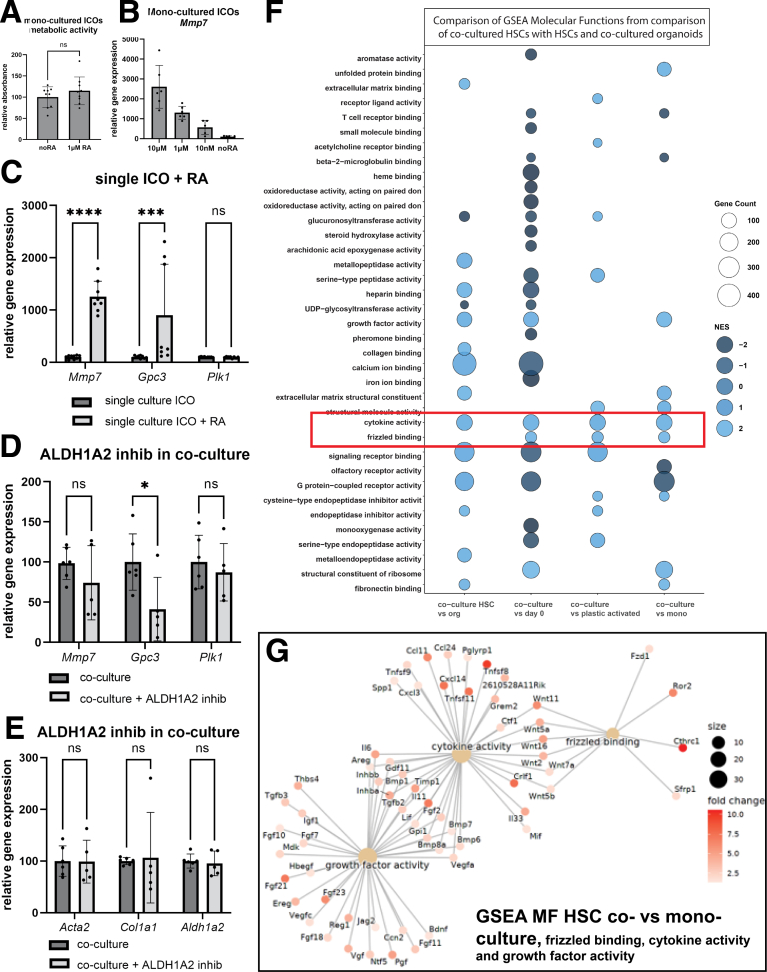
Results: In the 3D co-culture system, the proliferation of progenitor cells is enhanced, and HSCs are activated, recapitulating the cellular events observed in the patient liver. Both effects in 3D co-culture require close contact between the 2 different cell types. HSC activation during 3D co-culture differs from quiescent (3D mono-cultured) HSCs and activated HSCs on plastic (2D mono-culture). Upregulation of a cluster of genes containing Aldh1a2, Cthrc1, and several genes related to frizzled binding/Wnt signaling were exclusively observed in 3D co-cultured HSCs. The localized co-expression of specific genes was confirmed by spatial transcriptomics in human liver explants.

Conclusion: An in vitro 3D co-culture system provides evidence for direct interactions between HSCs and progenitor cells, which are sufficient to drive responses that are similar to those seen during ductular reaction and fibrosis. This model paves the way for further research into the cellular basis of liver pathology.

Keywords: Ductular Reaction; Intrahepatic Cholangiocyte Organoid; Liver Fibrosis; Retinoic Acid.


Figures

None
Graphical abstract
Figure 1
Figure 1
Activation of HSCs in mono-culture. Freshly isolated HSCs were cultured on plastic or in Matrigel (±10 ng/mL TGFβ1) for 7 days in co-culture medium. (A) Cells were harvested for RNA isolation with subsequent rt-qPCR on Lrat, Acta2, and Col1a1 gene expression. (B) Medium was collected and secretion of type I collagen was analyzed by ELISA. Cells were cultured in triplicate. Gene expression results were repeated for 5 different cell isolations. Data shown are from a representative experiment. ∗P < .05; ∗∗P < .01; ∗∗∗P < .001; ∗∗∗∗P < .0001
Figure 2
Figure 2
ICOs and HSCs in 3D co-culture influence each other. (A) Microscopy images of a 3D co-culture of HSCs and ICOs and a 3D mono-culture of ICOs after 7 days of culture. Scale bar = 400 μm. (B) In co-culture, one-half of the amount of HSCs and one-half of the amount of ICOs was plated as compared to their respective mono-culture. Therefore, the expected metabolic activity (when no interaction between different cell types takes place) is defined as the 0.5× (the metabolic activity of ICO 3D mono-culture + the metabolic activity of HSC 3D mono-culture). The signal measured in the 3D co-culture was significantly (P < .001) higher. (C) Confocal images of 3D mono- and 3D co-cultured HSCs in Matrigel. Blue = autofluorescence from retinyl esters; red = tdTomato from ICOs; arrows indicate HSCs. Scale bar = 36.6 μm. (D) Type 1 collagen secretion of 3D mono HSC culture vs 3D co-culture, data collected from 2 different experiments performed in triplicate. ∗P < .05; ∗∗P < .01; ∗∗∗P < .001; ∗∗∗∗P < .0001
Figure 3
Figure 3
Workflow of RNA sequence analysis in co-culture experiments. HSCs were freshly isolated from healthy mice, a day 0 sample was taken. tdTomato-positive mouse ICOs from EM culture conditions were fragmented. Both cell types were cultured for 7 days under various conditions as shown, with medium refreshed every 3 days. Cells were harvested and trypsinized to obtain single cells, after which the cells were sorted based on the tdTomato signal in the ICOs. Mono-cultures were taken through the same sorting procedure. Bulk RNA was isolated and sequenced. Data analysis panel shows a heatmap of differential gene expression (Log2 fold change of normalized counts) and the PCA for gene expression of both mono- and co-cultured HSCs and ICOs.
Figure 4
Figure 4
Changes in gene expression of ICOs during co-culture. (A) Heatmap of the top 75 DEGs comparing co-cultured ICOs with mono-cultured ICOs. (B) ORA of biological processes (BP) related to DEGs in co-cultured vs mono-cultured ICOs. (C) Heatmap of a selection of genes related to differentiation of progenitor state of ICOs. Also included are 3 genes (Gpc3, Mmp7, Cyp261b) from the top DEGs to show contrast. (D) Same genes from A shown in a volcano plot. (E) Bar charts from the RNA sequencing normalized counts for Mmp7 and Gpc3 expression over all samples.
Figure 5
Figure 5
Changes in gene expression of HSCs during co-culture. (A) Heatmap of the top 75 DEGs in 3D mono- versus co-cultured HSCs, with the expression in HSCs directly after isolation (day 0, quiescent HSCs) and 2D mono-cultured HSCs for 7 days (activated HSCs) for comparison. (B) ORA of biological processes (BP) related to DEGs (upregulated) in 3D co-cultured vs 3D mono-cultured HSCs. (C) Dot plot of genes associated with BP from B. (D) Heatmap of genes related to activation. (E) Volcano plot of DEG and (F) BP related to DEG both up and down regulated between 3D co- vs mono-cultured HSCs. (G) Relative gene expression of Aldh1a1, Aldh1a2, and Acta2, measured with rt-qPCR from cells from 3 experiments cultured in duplicate and sorted with FACS. Aldh1a2 expression was for each experiment highest in the co-cultured HSCs, although there was variation in the level of upregulation, varying from 2 until 45 times the amount found in 3D mono Matrigel culture. (H) Volcano plot comparing gene expression of plastic- vs co-culture-activated HSCs. (I) BP related to DEG both up and down regulated between plastic- vs co-culture-activated HSCs. (J) Network plot showing upregulated genes in plastic culture compared with co-cultured HSCs related to several BP shown in I.
Figure 6
Figure 6
Wnt and RA signaling in ICO-HSC co-cultures. (A) Metabolic activity (amount of viable cells) in mono-cultured ICOs with and without RA suppletion. (B) Concentration range for the effect of all-trans-RA on the expression of Mmp7 in mono-cultured ICOs. (C) Effect of the addition of 1 μM RA on mono-cultured ICOs on the expression of Mmp7, Gpc3, and Plk1, repeated 3 times in culture triplicate. (D–E) Effect of co-culture in the presence of the ALDH1A2 inhibitor WIN18,446 (2 μM) on the expression of Mmp7, Gpc3, and Plk1 (D) and Acta2, Col1a1 and Aldh1a2 (E). Data comes from 2 different mouse isolations for HSCs, cultured in triplicate. (F) Molecular functions (MF) identified by GSEA when comparing co-cultured HSCs with HSCs at day 0, after 7 days on plastic (2D), mono-cultured in Matrigel (3D), or co-cultured ICOs. Marked in red are the MFs upregulated in comparison to all other HSC conditions. (G) Dot plot of genes associated with MF frizzled binding, cytokine activity, and growth factor activity and found upregulated in co-cultured HSCs compared with 3D mono-cultured HSCs. ∗P < .05; ∗∗P < .01; ∗∗∗P < .001; ∗∗∗∗P < .0001
Figure 7
Figure 7
Effects of Wnt inhibitors on co- vs mono-culture proliferation, collagen production, and Aldh1a2 and Mmp7 expression. (A–C) Effect of C59 (100 nM) and IWP-2 (5 μM) on (C) metabolic activity, (D) procollagen secretion, and (E) relative gene expression (% compared with signal in co-culture) of Aldh1a2 and Mmp7 in co-culture or mono-cultured ICOs. Cells were cultured in triplicate. (D) Type I collagen secretion in the presence of the Wnt inhibitor C59 (100 nM) in co-culture. (E) Effect of co-culture in the presence of the Wnt inhibitor C59 (100 nM) on the expression of HSC-associated genes Col1a1, Acta2, and Aldh1a2 and Mmp7 (ICO-associated), Gpc3 (ICO-associated) and Plk1 (proliferation). (F–H) Effect of C59 (100 nM), ICG-001 (1 μM), LF-3 (5 μM), and SP600125 (10 μM) on metabolic activity, procollagen secretion, and relative gene expression. ∗P < .05; ∗∗P < .01; ∗∗∗P < .001; ∗∗∗∗P < .0001.
Figure 8
Figure 8
HSC activation requires close contact with organoids. (A) Top panels show microscopy pictures of a co-culture of ICOs (left panel, brightfield image) and HSCs (right panel, confocal microscopy) in close contact (ie, in the same Matrigel droplet). Bottom panels show the same type of images of a co-culture where HSCs and ICOs were plated without close contact (ie, in 2 separate Matrigel droplets in the same culture well). Scale bar left panels: 400 μm; right panels: 25 μm. (B) Metabolic activity (corresponding to cell amounts) expected based on 3D mono-cultured HSCs and ICOs, and the observed signal in co-culture with and without close contact. (C) Collagen type 1 secretion in the medium from HSCs in 3D mono-culture, co-culture with and without close contact. (D) Gene expression of HSC associated genes in co-culture with and without close contact. Data comes from 2 different mouse isolations cultured in triplicate. (E) Model based on the presented data, where (1) progenitor cells activate HSCs, which requires close contact, and (2) activated HSCs enhance progenitor cell proliferation. ∗P < .05; ∗∗P < .01; ∗∗∗P < .001; ∗∗∗∗P < .0001.
Figure 9
Figure 9
Markers of HSCs and DR colocalize within fibrotic liver regions of human explants. (A) Representative hematoxylin and eosin (HE) staining and spatial transcriptomics of liver sections from human liver explants. Dotted boxes indicate magnified regions. Spatial feature maps show expression of indicated genes. (B) Fraction of total RNA capture spots positive for indicated gene expression and located in parenchymal (pare) or fibrotic (fibro) regions as classified by spatial transcriptomics (n = 8 livers). (C) Spatial feature maps show expression of indicated genes. (D) Uniform manifold approximation and projections (UMAPs) indicate clustering analysis of differential gene content measured by spatial transcriptomics. Feature maps show spatial location of annotated clusters. (E) Heatmap of highly-expressed differential gene content per cluster measured by spatial transcriptomics. Rows represent genes, columns indicate RNA capture spots. Top 3 to 5 genes shown per cluster. (F) UMAPs showing expression of COL3A1, CTHRC1, MMP7, and GPC3 across all clusters. (G) Correlation matrix of genes related to HSCs or ductular reaction/progenitor cells within cluster 3. (H) Correlation gene expression matrix for COL3A1, MMP7, CTHRC1, and GPC3 within cluster 2 vs 3. ∗ = significant (P < .05).

References

    1. Asrani S.K., Devarbhavi H., Eaton J., Kamath P.S. Burden of liver diseases in the world. J Hepatol. 2019;70:151–171. - PubMed
    1. Rinella M.E., Lazarus J.V., Ratziu V., et al. NAFLD Nomenclature consensus group A multi-society Delphi consensus statement on new fatty liver disease nomenclature. Ann Hepatol. 2024;29 - PubMed
    1. Sato K., Marzioni M., Meng F., et al. Ductular reaction in liver diseases: pathological mechanisms and translational significances. Hepatology. 2019;69:420–430. - PMC - PubMed
    1. Chen Y., Gao W.K., Shu Y.Y., Ye J. Mechanisms of ductular reaction in non-alcoholic steatohepatitis. World J Gastroenterol. 2022;28:2088–2099. - PMC - PubMed
    1. Roskams T.A., Theise N.D., Balabaud C., et al. Nomenclature of the finer branches of the biliary tree: canals, ductules, and ductular reactions in human livers. Hepatology. 2004;39:1739–1745. - PubMed